Forecast - 2026 US midterm elections
House. Democrats favoured: Democrats win the 218-seat majority in 79.1% of the 200,000 simulations, with 229 seats on average (they have held 215 since 2024).
Senate. Toss-up: Democrats and allied independents reach 51 seats in 48.3% of the simulations (50.4 seats on average, 47 today). At 50-50 the Republican vice president breaks ties.
Governors. Of the 48 seats computed, 23.7 Democrats and 24.3 Republicans expected: Republicans would keep most governorships.
How the election can play out
The four possible outcomes for Congress; they add up to 100%. House and Senate are simulated together, with the same national polling error: if the polls miss in one chamber, they miss in the same direction in the other.
How to read. Each figure is the share of the 200,000 simulations in which the outcome happens. Assumption: the national polling error is the same for both chambers; regional, state and district errors stay independent. This link cannot be estimated from past midterms alone. The four figures are adjusted to match exactly each chamber's chances shown above. The Senate counts independents with no Democratic opponent with the Democrats.
How the chances have moved
One point per day since 1 August 2026. Points up to and including 22 October 2026 were recomputed afterwards with the current method and only the data published by each date (polls whose fieldwork had closed, finance and indicators already released). Hover or tap the chart to read each day.
House, D chancesSenate, D + allied I chances
Democrats control both chambers: 45.9% (joint simulation of both chambers, see “How the election can play out”).
The electoral map
The three elections state by state. Hover or tap a state for its figures.
House · 435 seats
Colour: share of the state's seats expected for each side (sum of each district's chances).
Senate · 35 races
Governors · 36 races
Colour: chances of the Democratic side, or of the independent where they are the main challenger.
Categories: Toss-up below a 60% chance for the favourite, Lean from 60 to 75%, Likely from 75 to 95%, Safe above. Independents with no Democratic opponent, Achilles (Idaho), Bodnar (Montana), Osborn (Nebraska) and Bengs (South Dakota), are shaded like the Democrats, with whom they are counted. Alaska and Maine (governors): multi-candidate contests, not yet probabilized.
The House of Representatives
Distribution of Democratic seats over 200,000 simulations. Blue: Democratic majority (218 seats or more).
Map, 435 districts and detailed sheets →
The closest districts
| District | Candidates | Expected D share | D chances | Category |
|---|---|---|---|---|
| NY-17 |  Cait Conley D  Mike Lawler R | 50.1 % | 50.5% | Toss-up |
| MT-01 | Sam Forstag DAaron Flint R | 49.9 % | 49.4% | Toss-up |
| NC-11 | Jamie Ager D Jennifer Balkcom R | 49.8 % | 48.4% | Toss-up |
| AZ-01 |  Amish Shah D  Jay Feely R | 50.4 % | 53.9% | Toss-up |
| PA-10 |  Janelle Stelson D  Scott Perry R | 49.5 % | 45.9% | Toss-up |
| NY-01 | Chris Gallant D Nick LaLota R | 49.5 % | 45.7% | Toss-up |
| CO-05 | Jessica Killin D Jeff Crank R | 49.5 % | 45.4% | Toss-up |
| PA-08 | 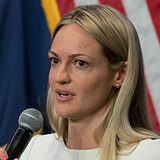 Paige Cognetti D 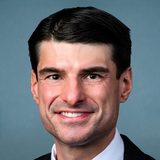 Rob Bresnahan R | 50.6 % | 55.3% | Toss-up |
| OH-09 |  Marcy Kaptur D  Derek Merrin R | 49.3 % | 43.7% | Toss-up |
| OH-01 |  Greg Landsman DEric Conroy R | 50.8 % | 57.1% | Toss-up |
| PA-01 | Bob Harvie D Brian Fitzpatrick R | 49.0 % | 41.3% | Toss-up |
| TX-15 | 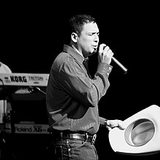 Bobby Pulido D  Monica De La Cruz R | 51.2 % | 60.6% | Lean Democratic |
| ME-02 |  Matthew Dunlap D  Paul LePage R | 48.8 % | 39.0% | Lean Republican |
| CO-03 | 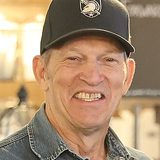 Dwayne Romero D  Jeff Hurd R | 48.7 % | 39.0% | Lean Republican |
| WA-03 |  Marie Gluesenkamp Perez D  John Braun R | 48.7 % | 38.5% | Lean Republican |
| MI-07 | William Lawrence DTom Barrett R | 51.3 % | 61.8% | Lean Democratic |
| FL-25 |  Jared Moskowitz D 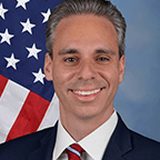 Scott Singer R | 48.6 % | 38.1% | Lean Republican |
| IN-05 |  J. D. Ford D  Victoria Spartz R | 48.6 % | 37.9% | Lean Republican |
| NJ-07 | Rebecca Bennett D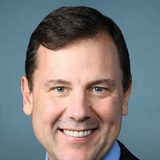 Thomas Kean Jr. R | 51.4 % | 62.2% | Lean Democratic |
| PA-07 | Bob Brooks D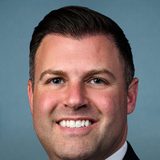 Ryan Mackenzie R | 51.4 % | 62.6% | Lean Democratic |
Senate
35 seats up, 65 not up (32 D, 2 allied independents, 31 R). At 50-50 the Republican vice president breaks ties: Democrats need 51 seats.
Map, 35 races and race-by-race calculations →
| State | D / I candidate | R candidate | Margin | D / I chances | Category | |
|---|---|---|---|---|---|---|
| ME |  Troy D. Jackson D |  Susan M. Collins R | D +0.3 | 51.8% | Toss-up | |
| TX | 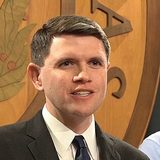 James Talarico D | 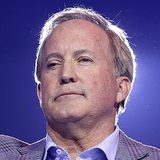 Ken Paxton R | D +1.0 | 55.2% | Toss-up | |
| IA | Josh Turek D | 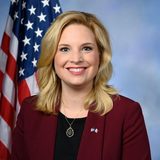 Ashley Hinson R | R +3.1 | 33.4% | Lean Republican | |
| LA | "Jamie" Davis D |  Julia Letlow R | R +3.2 | 33.1% | Lean Republican | |
| KS |  Adam Hamilton D |  Roger Marshall R | R +3.8 | 29.9% | Lean Republican | |
| MI |  Abdul El-Sayed D | 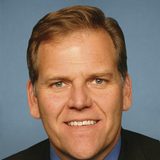 Mike Rogers R | D +4.1 | 71.2% | Lean Democratic | |
| OH |  Sherrod Brown D | 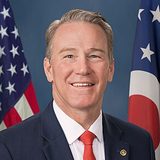 Jon Husted R | R +5.1 | 24.0% | Likely Republican | |
| NE |  Dan Osborn I | 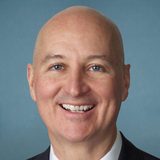 Pete Ricketts R | R +8.5 | 23.9% | Likely Republican | |
| MN |  Peggy Flanagan D | 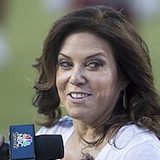 Michele Tafoya R | D +5.5 | 77.6% | Likely Democratic | |
| AK |  Mary Peltola D |  Dan S. Sullivan R | R +5.9 | 20.9% | Likely Republican | |
| SC | 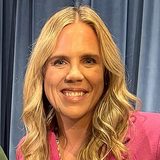 Annie Andrews D |  Darline Graham R | R +6.4 | 18.8% | Likely Republican | |
| NH | 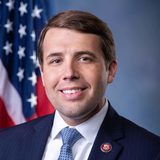 Chris Pappas D | 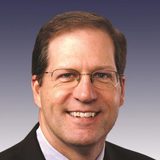 John E. Sununu R | D +6.7 | 82.0% | Likely Democratic | |
| MT |  Seth Bodnar I | 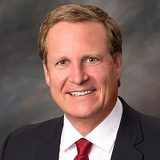 Kurt Alme R | R +11.1 | 17.8% | Likely Republican | other candidate: at most 2.2% |
| NC |  Roy Cooper D |  Michael Whatley R | D +8.6 | 88.0% | Likely Democratic | |
| ID |  Todd Achilles I | 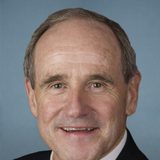 Jim Risch R | R +14.4 | 11.6% | Likely Republican | |
| IL | 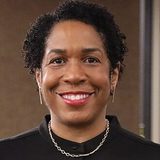 Juliana Stratton D | Don Tracy R | D +13.2 | 93.7% | Likely Democratic | |
| SD |  Brian Bengs I |  Mike Rounds R | R +18.5 | 6.2% | Likely Republican | |
| GA |  Jon Ossoff D |  Mike Collins R | D +11.2 | 93.9% | Likely Democratic |
Governors
36 seats up, 14 not up (6 D, 8 R). Alaska (ranked-choice) and Maine (three candidates) are not yet given probabilities.
Map, 36 races and state-by-state calculation sheets →
| State | Democrat | Republican | Margin | D chances | Category |
|---|---|---|---|---|---|
| OH |  Amy Acton / David Pepper D |  Vivek Ramaswamy / Rob McColley R | R +1.3 | 40.1% | Toss-up |
| NV |  Aaron Ford D |  Joe Lombardo R | R +1.5 | 38.7% | Lean Republican |
| VT |  Amanda Janoo D |  Phil Scott R | R +1.6 | 38.2% | Lean Republican |
| GA |  Keisha Lance Bottoms D |  Rick Jackson R | R +1.6 | 38.1% | Lean Republican |
| WI |  David Crowley / Sarah Godlewski D |  Tom Tiffany / David Varnam R | D +1.8 | 63.4% | Lean Democratic |
| OR |  Tina Kotek D |  Christine Drazan R | D +1.8 | 63.5% | Lean Democratic |
| IA |  Rob Sand (Lt: Dave Muhlbauer) D |  Zach Lahn (Lt: Derek Wulf) R | D +2.5 | 68.1% | Lean Democratic |
| KS |  Cindy Holscher / KC Ohaebosim D |  Ty Masterson / Jeffrey Klemp R | R +2.7 | 30.1% | Lean Republican |
| TX |  Gina Hinojosa D |  Greg Abbott R | R +5.1 | 16.3% | Likely Republican |
| MI |  Jocelyn Benson / Winnie Brinks D |  John James / Jay DeBoyer R | D +6.1 | 87.9% | Likely Democratic |
| AZ |  Katie Hobbs (Lt: John Giles) D |  Andy Biggs (Lt: Sine Kerr) R | D +6.3 | 88.7% | Likely Democratic |
| NM | 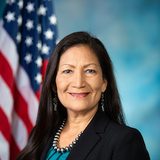 Deb Haaland D | Greggory D. Hull R | D +7.3 | 91.9% | Likely Democratic |
The campaign in the polls
National generic ballot (likely voters): each dot is a poll published since June, as the Democratic minus Republican margin. The line is a descriptive 21-day rolling average. The model applies its own aggregation rule.
74 polls from 30 pollsters, 17 June 2026 to 30 October 2026. Value used by the model on 3 November 2026: Democrats +7.3 points over Republicans, before the polling bias correction. Sources: Decision Desk HQ until 1 October, then Wikipedia and PollsMax, collected daily.
The test on past elections
Each engine was replayed on past midterms, with only the data available at the test date.
| Engine | Test | Error | Probabilities |
|---|---|---|---|
| House, national | 2010, 2014, 2018 at day −60 | 1.46 points of Democratic share | error carried into the 200,000 simulations |
| House, districts | 984 contests 2010-2018, out of sample | margin: RMSE 9.86 points (10.18 without finance) | Brier 0.062 |
| House, polled districts | 214 districts 2014-2022, leave one year out | margin: RMSE 7.30 points with polls (12.05 without) | correct winner 80.4% (72.9% without) |
| Senate | 132 races 2014-2022, leave one year out | margin: mean error 4.58 points, RMSE 5.92 | correct winner 90.9% |
| Governors | 144 races 2010-2022, leave one year out, from 45 days before the vote to election day | margin: mean error 6.66 points at day −45, 5.77 at day −30, 5.31 at day −21, 3.94 at day −7, 3.71 on election day | correct winner 86.8% at day −45, 91.0% at day −30, 93.8% on election day · Brier 0.086 → 0.052 |
| Senate, incumbents and former officeholders | 148 races 2014-2022, leave one year out, 17 days before the vote | margin: mean error 4.92 → 4.46 points, RMSE 6.78 → 6.21 | correct winner 87.8% → 89.2% · Brier 0.061 → 0.054 |
| Polling corrections (state, pollster, partisan) | polled races 2014-2022, leave one year out, 17 days before the vote | mean polling error: Senate 5.01 → 4.49, governors 5.17 → 4.54, House 7.27 → 5.69 points | Senate correct winner 91.0% → 93.1% |
The generic ballot against the results
| Midterm | Polls at day −45 | Actual national vote | Gap, vote − polls |
|---|---|---|---|
| 2006 | D +9.2 | D +8.0 | R +1.2 |
| 2010 | R +3.6 | R +6.8 | R +3.2 |
| 2014 | R +1.8 | R +5.7 | R +3.9 |
| 2018 | D +8.8 | D +8.6 | R +0.2 |
| 2022 | D +1.8 | R +2.7 | R +4.5 |
Democratic minus Republican margin, in points. Polls overstated Democrats in 5 of 5 midterms; the model therefore takes off every poll the average 2006 to 2022 midterm gap at the same distance from election day (2.95 points a month out, 2.26 on the eve). Sources: FiveThirtyEight average, Clerk of the House.
The 2024 election
The starting point: the Congress and governors elected in 2024.
| House | D 215 · R 220 | |
| Senate | D 45 · I 2 · R 53 | |
| Governors | D 23 · R 27 |
House: national vote 49.8% Republican, 47.2% Democratic. Senate after 2024: 53 Republicans, 45 Democrats, 2 independents who caucus with them. Sources: Wikipedia, from the Clerk of the House and official state returns.
How it works
A forecasting model is not one more poll. It gathers what can be measured: published polls, past results, incumbency, fundraising. From these it derives a distribution of possible outcomes, with their probability.
Three engines
House, Senate and governors each have their own engine, validated on past midterms. All start from the same national environment, the likely-voter generic ballot, recomputed daily.
Past polling errors
Polls missed in every midterm, most often in favour of Democrats. The model therefore takes off the polls their average overstatement of Democrats in the 2006 to 2022 midterms at the same distance from election day (2.26 to 2.95 points), then replays the size of the remaining errors in both directions.
Two hundred thousand simulations
Each chamber is replayed 200,000 times, with a national error shared by every race and an error specific to each race. The probability shown is the share of simulations in which the event happens.
What remains outside the calculation
House and Senate are simulated with the same national polling error, an assumption that cannot be checked over four midterms. Candidates outside the top two are bounded by the polls, and Alaska and Maine (governors) are not yet probabilized.
Sources
Polls: Decision Desk HQ until 1 October, then Wikipedia, 270toWin and PollsMax, collected daily, with pollsters’ own releases; pollster reliability ratings from the FiveThirtyEight public archive; 265 of the 373 polls used since 1 September checked against the pollster’s or sponsor’s own release. Past results: Clerk of the House, Federal Election Commission, MIT Election Data and Science Lab. Fundraising: Federal Election Commission public files. Candidates: state election authorities. Generic ballot history: FiveThirtyEight.
Credits
All rights belong to Le Millénaire SAS, 47 rue de Vivienne, 75002 Paris.
Election night
On 3 November, the live count: overview · House · Senate · governors
Model designed by
Project director: William Thay
Deputy project director: Sean Scull / Pierre Clairé
Political and data analysis: Matthieu Hocque / Augustin Bataille
Data analysis, mathematics and validation: Florian Gérard-Mercier