Each race starts from the state’s 2024 presidential vote, the national climate and whether an incumbent governor is on the ballot. The weight of each element is estimated on the 2010 to 2022 elections.
Forecast - 2026 US midterm elections: governors
Republicans would keep most governorships
Expected governorships out of 48 counted

Democrats incl. 6 not up
22.0
expected governorships
90% interval: 19 to 25

Republicans incl. 8 not up
26.0
expected governorships
90% interval: 23 to 29
AK·ME
Alaska and Maine
2
not probabilized
ranked-choice in Alaska, three candidates in Maine
36 governorships up, 14 not up (6 Democratic, 8 Republican). Structural mean: the state’s 2024 presidential result, the national environment and an incumbent governor on the ballot. Each race's polls are blended into this mean, with a weight that grows as the vote nears. Updated October 24, 2026.
Expected Democratic governors since August 1
20.7 → 22.2
MAP
Map of the 36 races
National view · 50 states · 36 races
R more likely≈ 50/50D more likelyNot probabilizedNo election in 2026
National simulation
How many governorships for each side
Each bar gives the probability of a number of Democratic governors across the 48 governorships counted: the 34 races that get a probability and the 14 seats not up this year.
Latest update, October 24 | Expected Democratic governors: 22.2 → 22.2. Biggest moves: Nevada, Aaron Ford (D 19% → 14%, on the national environment alone) ; Arizona, Katie Hobbs (Lt: John Giles) (D 89% → 86%, on the national environment alone) ; Kansas, Cindy Holscher / KC Ohaebosim (D 11% → 14%, on the national environment alone).
22.0expected Democratic governors out of 48 · 9 in 10 chance between 19 and 2526.0expected Republican governors out of 48 · 9 in 10 chance between 23 and 29Alaska and Maine get no probability: ranked-choice voting in Alaska, three serious candidates in Maine. Depending on their outcome, Democrats would end with 22.0 to 24.0 expected governorships out of 50.
Seats by level of certainty
Safe799%+
Very likely485-99%
Likely265-85%
Uncertain4under 65%
Likely365-85%
Very likely785-99%
Safe799%+
9 competitive races (under 85%)
Close races
The races that will make the difference
The 6 races where each side keeps at least a one-in-four chance, from closest to least close.
WisconsinINCUMBENT D · RETIRING
David CrowleyTom Tiffany51%49%
Expected margin: D +0.1
Poll average: D +0.7 (3 pollsters)
Last election (2022): D +3.4
Poll average: D +0.7 (3 pollsters)
Last election (2022): D +3.4
OregonINCUMBENT D · RUNNING
Tina KotekChristine Drazan62%38%
Expected margin: D +1.8
Poll average: R +0.0 (2 pollsters)
Last election (2022): D +3.4
Poll average: R +0.0 (2 pollsters)
Last election (2022): D +3.4
ColoradoINCUMBENT D · TERM-LIMITED
Phil WeiserVictor Marx64%36%
Expected margin: D +4.6
No recent poll
Last election (2022): D +19.3
No recent poll
Last election (2022): D +19.3
IowaINCUMBENT R · RETIRING
Rob SandZach Lahn64%36%
Expected margin: D +2.0
Poll average: D +4.1 (11 pollsters)
Last election (2022): R +18.5
Poll average: D +4.1 (11 pollsters)
Last election (2022): R +18.5
OhioINCUMBENT R · TERM-LIMITED
Amy ActonVivek Ramaswamy32%68%
Expected margin: R +2.7
Poll average: R +1.2 (12 pollsters)
Last election (2022): R +25.0
Poll average: R +1.2 (12 pollsters)
Last election (2022): R +25.0
GeorgiaINCUMBENT R · TERM-LIMITED
Keisha Lance BottomsRick Jackson26%74%
Expected margin: R +3.8
Poll average: R +2.9 (7 pollsters)
Last election (2022): R +7.5
Poll average: R +2.9 (7 pollsters)
Last election (2022): R +7.5
The 36 races
Every race, from most Democratic to most Republican
The chance shown is the favourite’s. The expected margin is the centre of the forecast, with the range that holds the result 9 times out of 10. “Flip” marks a governorship whose favourite is not the party in office. Alaska and Maine are at the end, without probability.
| State | Chance of winning | Expected margin |
|---|---|---|
| MarylandIncumbent DWes Moore / Dan Cox | >99%D chance | D +25.7D +16 to D +35 |
| Rhode IslandIncumbent DHelena Buonanno Foulkes / Aaron C. Guckian | >99%D chance | D +22.8D +13 to D +32 |
| MassachusettsIncumbent DMaura Healey / Michael Roger Minogue | >99%D chance | D +22.1D +13 to D +32 |
| CaliforniaIncumbent DXavier Becerra / Steve Hilton | >99%D chance | D +21.2D +12 to D +31 |
| PennsylvaniaIncumbent DJosh Shapiro / Stacy Garrity | >99%D chance | D +19.6D +10 to D +29 |
| ConnecticutIncumbent DNed Lamont / Ryan Fazio | >99%D chance | D +16.7D +7 to D +26 |
| IllinoisIncumbent DJB Pritzker / Darren Bailey | >99%D chance | D +16.6D +7 to D +26 |
| New YorkIncumbent DKathy Hochul / Bruce Blakeman | 98%D chance | D +11.7D +2 to D +21 |
| HawaiiIncumbent DJosh Green / Gary Cordery | 96%D chance | D +22.9D +1 to D +45 |
| New MexicoIncumbent DDeb Haaland / Greggory D. Hull | 87%D chance | D +6.6R +3 to D +16 |
| ArizonaIncumbent DKatie Hobbs / Andy Biggs | 86%D chance | D +6.4R +3 to D +16 |
| MinnesotaIncumbent DAmy Klobuchar / Lisa Demuth | 80%D chance | D +4.8R +5 to D +14 |
| MichiganIncumbent DJocelyn Benson / John James | 75%D chance | D +4.0R +6 to D +14 |
| Iowa flipIncumbent RRob Sand / Zach Lahn | 64%D chance | D +2.0R +8 to D +12 |
| ColoradoIncumbent DPhil Weiser / Victor Marx | 64%D chance | D +4.6R +17 to D +26 |
| OregonIncumbent DTina Kotek / Christine Drazan | 62%D chance | D +1.8R +8 to D +11 |
| WisconsinIncumbent DDavid Crowley / Tom Tiffany | 51%D chance | D +0.1R +9 to D +10 |
| OhioIncumbent RAmy Acton / Vivek Ramaswamy | 68%R chance | R +2.7R +12 to D +7 |
| GeorgiaIncumbent RKeisha Lance Bottoms / Rick Jackson | 74%R chance | R +3.8R +13 to D +6 |
| VermontIncumbent RAmanda Janoo / Phil Scott | 80%R chance | R +4.9R +14 to D +5 |
| NevadaIncumbent RAaron Ford / Joe Lombardo | 86%R chance | R +6.2R +16 to D +3 |
| Kansas flipIncumbent DCindy Holscher / Ty Masterson | 86%R chance | R +6.4R +16 to D +3 |
| TexasIncumbent RGina Hinojosa / Greg Abbott | 87%R chance | R +6.5R +16 to D +3 |
| FloridaIncumbent RDavid Jolly / Byron Donalds | 93%R chance | R +8.7R +18 to D +1 |
| NebraskaIncumbent RLynne Walz / Jim Pillen | 96%R chance | R +10.3R +20 to R +1 |
| South CarolinaIncumbent RJermaine Johnson / Alan Wilson | 98%R chance | R +12.2R +22 to R +3 |
| New HampshireIncumbent RCinde Warmington / Kelly Ayotte | 98%R chance | R +12.4R +22 to R +3 |
| OklahomaIncumbent RCyndi Munson / Mike Mazzei | >99%R chance | R +16.2R +26 to R +7 |
| WyomingIncumbent RKenneth R. Casner / Eric Barlow | >99%R chance | R +36.7R +58 to R +15 |
| AlabamaIncumbent RDoug Jones / Tommy Tuberville | >99%R chance | R +17.2R +27 to R +8 |
| IdahoIncumbent RTerri Pickens / Brad Little | >99%R chance | R +18.0R +28 to R +8 |
| TennesseeIncumbent RJerri Green / Marsha Blackburn | >99%R chance | R +19.1R +29 to R +9 |
| ArkansasIncumbent RFred Love / Sarah Huckabee Sanders | >99%R chance | R +25.1R +35 to R +15 |
| South DakotaIncumbent RDan Ahlers / Larry Rhoden | >99%R chance | R +26.7R +36 to R +17 |
| AlaskaIncumbent RJonathan S. Kreiss-Tomkins / Treg Taylor | no probability | R +10.9 |
| MaineIncumbent DHannah M. Pingree / Robert B. Charles | no probability | D +0.9 |
Race by race calculation
How each figure is obtained
Two blocks: the state’s structure and the race polls, weighted by their past accuracy. Then the uncertainty, which gives the probability.
Alabama
Doug Jones (D) vs Tommy Tuberville (R)Chance of winning
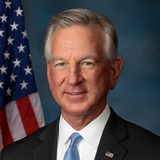 Tommy Tuberville (R)99.8%
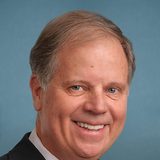 Doug Jones (D)0.2%
What drives the forecast
Effect of each element on the expected margin, in points. The total is the forecast margin.
How the forecast has moved
Each candidate's chance of winning, out of 100 (the two add up to 100%). Curve since August 1, recomputed day by day with only the data published at each date.
Two-candidate vote share. Band: 90% range. Curve since August 1, recomputed day by day with only the data published at each date.
Polls used
| Pollster | Field end | D–R |
|---|---|---|
| Cygnal | Oct. 17 | 40–51 |
| The Alabama Poll | Oct. 16 | 39–51 |
| RMG Research | Sept. 25 | 37–50 |
From expected margin to probability
- 90% range
- R +26.8 to R +7.5
- Democratic chance
- 0.2%
- Republican chance
- 99.8%
Error measured out of sample on the 2010 to 2022 elections, with or without polls depending on the race.
Figures are in points of margin between the two candidates. Polls come from Wikipedia and 270toWin; the link goes to the pollster’s document when it is cited.
Alaska
Jonathan S. Kreiss-Tomkins / Zac Johnson (D) vs Treg Taylor / Candi English (R)no probability
Polls used
No poll used for this race.
From expected margin to probability
Race without probability: a ranked-choice contest (Alaska) or one with three serious candidates (Maine) needs a dedicated calculation. The structural centre is given for information.
Figures are in points of margin between the two candidates. Polls come from Wikipedia and 270toWin; the link goes to the pollster’s document when it is cited.
Arizona
Katie Hobbs (Lt: John Giles) (D) vs Andy Biggs (Lt: Sine Kerr) (R)Chance of winning
 Katie Hobbs (Lt: John Giles) (D)86.2%
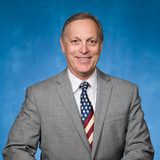 Andy Biggs (Lt: Sine Kerr) (R)13.8%
What drives the forecast
Effect of each element on the expected margin, in points. The total is the forecast margin.
How the forecast has moved
Each candidate's chance of winning, out of 100 (the two add up to 100%). Curve since August 1, recomputed day by day with only the data published at each date.
Two-candidate vote share. Band: 90% range. Curve since August 1, recomputed day by day with only the data published at each date.
Polls used
| Pollster | Field end | D–R |
|---|---|---|
| GrayHouse | Oct. 20 | 51–45 |
| BSP Research | Oct. 19 | 47–34 |
| HighGround, Inc. | Oct. 8 | 51–34 |
| Wick | Oct. 6 | 49–43 |
| GQR | Oct. 5 | 49–45 |
| Equis Research | Sept. 9 | 49–43 |
From expected margin to probability
- 90% range
- R +3.3 to D +16.0
- Democratic chance
- 86.2%
- Republican chance
- 13.8%
Error measured out of sample on the 2010 to 2022 elections, with or without polls depending on the race.
Figures are in points of margin between the two candidates. Polls come from Wikipedia and 270toWin; the link goes to the pollster’s document when it is cited.
Arkansas
Fred Love (D) vs Sarah Huckabee Sanders (R)Chance of winning
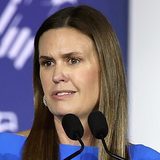 Sarah Huckabee Sanders (R)100.0%
Fred Love (D)0.0%
What drives the forecast
Effect of each element on the expected margin, in points. The total is the forecast margin.
How the forecast has moved
Each candidate's chance of winning, out of 100 (the two add up to 100%). Curve since August 1, recomputed day by day with only the data published at each date.
Two-candidate vote share. Band: 90% range. Curve since August 1, recomputed day by day with only the data published at each date.
Polls used
| Pollster | Field end | D–R |
|---|---|---|
| Hendrix College | Oct. 13 | 32–51 |
From expected margin to probability
- 90% range
- R +34.7 to R +15.5
- Democratic chance
- 0.0%
- Republican chance
- 100.0%
Error measured out of sample on the 2010 to 2022 elections, with or without polls depending on the race.
Figures are in points of margin between the two candidates. Polls come from Wikipedia and 270toWin; the link goes to the pollster’s document when it is cited.
California
Xavier Becerra (D) vs Steve Hilton (R)Chance of winning
 Xavier Becerra (D)100.0%
 Steve Hilton (R)0.0%
What drives the forecast
Effect of each element on the expected margin, in points. The total is the forecast margin.
How the forecast has moved
Each candidate's chance of winning, out of 100 (the two add up to 100%). Curve since August 1, recomputed day by day with only the data published at each date.
Two-candidate vote share. Band: 90% range. Curve since August 1, recomputed day by day with only the data published at each date.
Polls used
| Pollster | Field end | D–R |
|---|---|---|
| Emerson College | Oct. 19 | 60–33 |
| ActiVote | Oct. 16 | 63–37 |
| UC Berkeley Citrin Center/TrueDot/Politico | Oct. 14 | 55–35 |
| Independent Voter Project | Oct. 2 | 48–38 |
| Manhattan Institute | Oct. 1 | 55–38 |
| Berkeley IGS | Sept. 20 | 58–33 |
| SurveyUSA | Sept. 20 | 55–33 |
| PPIC | Sept. 10 | 60–38 |
From expected margin to probability
- 90% range
- D +11.5 to D +30.8
- Democratic chance
- 100.0%
- Republican chance
- 0.0%
Error measured out of sample on the 2010 to 2022 elections, with or without polls depending on the race.
Figures are in points of margin between the two candidates. Polls come from Wikipedia and 270toWin; the link goes to the pollster’s document when it is cited.
Colorado
Phil Weiser / Lesley Dahlkemper (D) vs Victor Marx / George Washington Markert (R)Chance of winning
 Phil Weiser / Lesley Dahlkemper (D)63.5%
 Victor Marx / George Washington Markert (R)36.5%
What drives the forecast
Effect of each element on the expected margin, in points. The total is the forecast margin.
How the forecast has moved
Each candidate's chance of winning, out of 100 (the two add up to 100%). Curve since August 1, recomputed day by day with only the data published at each date.
Two-candidate vote share. Band: 90% range. Curve since August 1, recomputed day by day with only the data published at each date.
Polls used
No poll used for this race.
From expected margin to probability
- 90% range
- R +17.2 to D +26.4
- Democratic chance
- 63.5%
- Republican chance
- 36.5%
Error measured out of sample on the 2010 to 2022 elections, with or without polls depending on the race.
Figures are in points of margin between the two candidates. Polls come from Wikipedia and 270toWin; the link goes to the pollster’s document when it is cited.
Connecticut
Ned Lamont (D) vs Ryan Fazio (R)Chance of winning
 Ned Lamont (D)99.8%
 Ryan Fazio (R)0.2%
What drives the forecast
Effect of each element on the expected margin, in points. The total is the forecast margin.
How the forecast has moved
Each candidate's chance of winning, out of 100 (the two add up to 100%). Curve since August 1, recomputed day by day with only the data published at each date.
Two-candidate vote share. Band: 90% range. Curve since August 1, recomputed day by day with only the data published at each date.
Polls used
| Pollster | Field end | D–R |
|---|---|---|
| Quinnipiac University | Oct. 12 | 58–38 |
| Emerson College | Oct. 12 | 51–38 |
| GreatBlue Research | Oct. 12 | 53–31 |
| Wesleyan University/YouGov | Oct. 12 | 57–34 |
| University of New Hampshire | Sept. 21 | 55–38 |
| co/efficient | Sept. 17 | 48–41 |
From expected margin to probability
- 90% range
- D +7.1 to D +26.3
- Democratic chance
- 99.8%
- Republican chance
- 0.2%
Error measured out of sample on the 2010 to 2022 elections, with or without polls depending on the race.
Figures are in points of margin between the two candidates. Polls come from Wikipedia and 270toWin; the link goes to the pollster’s document when it is cited.
Florida
David Jolly / Gwen Graham (D) vs Byron Donalds / Bryan Avila (R)Chance of winning
 Byron Donalds / Bryan Avila (R)93.1%
 David Jolly / Gwen Graham (D)6.9%
What drives the forecast
Effect of each element on the expected margin, in points. The total is the forecast margin.
How the forecast has moved
Each candidate's chance of winning, out of 100 (the two add up to 100%). Curve since August 1, recomputed day by day with only the data published at each date.
Two-candidate vote share. Band: 90% range. Curve since August 1, recomputed day by day with only the data published at each date.
Polls used
| Pollster | Field end | D–R |
|---|---|---|
| co/efficient | Oct. 20 | 40–49 |
| ActiVote | Oct. 19 | 48–52 |
| University of North Florida | Oct. 19 | 47–49 |
| Univision/YouGov | Oct. 15 | 42–50 |
| Fabrizio, Lee & Associates | Oct. 11 | 43–49 |
| Change Research | Oct. 10 | 47–47 |
| MDW Communications | Oct. 10 | 44–46 |
| Stetson University | Oct. 9 | 41–52 |
| St. Pete Polls | Oct. 7 | 45–45 |
| YouGov | Oct. 5 | 45–47 |
| Targoz Market Research | Oct. 4 | 42–52 |
| Mason-Dixon | Oct. 1 | 41–48 |
From expected margin to probability
- 90% range
- R +18.3 to D +0.9
- Democratic chance
- 6.9%
- Republican chance
- 93.1%
Error measured out of sample on the 2010 to 2022 elections, with or without polls depending on the race.
Figures are in points of margin between the two candidates. Polls come from Wikipedia and 270toWin; the link goes to the pollster’s document when it is cited.
Georgia
Keisha Lance Bottoms (D) vs Rick Jackson (R)Chance of winning
 Rick Jackson (R)74.5%
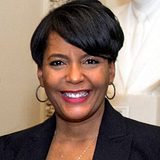 Keisha Lance Bottoms (D)25.5%
What drives the forecast
Effect of each element on the expected margin, in points. The total is the forecast margin.
How the forecast has moved
Each candidate's chance of winning, out of 100 (the two add up to 100%). Curve since August 1, recomputed day by day with only the data published at each date.
Two-candidate vote share. Band: 90% range. Curve since August 1, recomputed day by day with only the data published at each date.
Polls used
| Pollster | Field end | D–R |
|---|---|---|
| ActiVote | Oct. 20 | 48–52 |
| Quantus Insights | Oct. 17 | 47–48 |
| University of Georgia | Oct. 15 | 45–46 |
| InsiderAdvantage | Oct. 13 | 47–49 |
| Big Data Poll | Sept. 23 | 47–49 |
| YouGov | Sept. 18 | 44–46 |
| Rasmussen Reports | Sept. 14 | 45–48 |
From expected margin to probability
- 90% range
- R +13.5 to D +5.8
- Democratic chance
- 25.5%
- Republican chance
- 74.5%
Error measured out of sample on the 2010 to 2022 elections, with or without polls depending on the race.
Figures are in points of margin between the two candidates. Polls come from Wikipedia and 270toWin; the link goes to the pollster’s document when it is cited.
Hawaii
Josh Green (D) vs Gary Cordery (R)Chance of winning
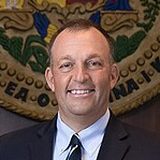 Josh Green (D)95.8%
 Gary Cordery (R)4.2%
What drives the forecast
Effect of each element on the expected margin, in points. The total is the forecast margin.
How the forecast has moved
Each candidate's chance of winning, out of 100 (the two add up to 100%). Curve since August 1, recomputed day by day with only the data published at each date.
Two-candidate vote share. Band: 90% range. Curve since August 1, recomputed day by day with only the data published at each date.
Polls used
No poll used for this race.
From expected margin to probability
- 90% range
- D +1.1 to D +44.7
- Democratic chance
- 95.8%
- Republican chance
- 4.2%
Error measured out of sample on the 2010 to 2022 elections, with or without polls depending on the race.
Figures are in points of margin between the two candidates. Polls come from Wikipedia and 270toWin; the link goes to the pollster’s document when it is cited.
Idaho
Terri Pickens (D) vs Brad Little (R)Chance of winning
 Brad Little (R)99.9%
 Terri Pickens (D)0.1%
What drives the forecast
Effect of each element on the expected margin, in points. The total is the forecast margin.
How the forecast has moved
Each candidate's chance of winning, out of 100 (the two add up to 100%). Curve since August 1, recomputed day by day with only the data published at each date.
Two-candidate vote share. Band: 90% range. Curve since August 1, recomputed day by day with only the data published at each date.
Polls used
| Pollster | Field end | D–R |
|---|---|---|
| Advanced Targeting Research | Sept. 16 | 27–37 |
From expected margin to probability
- 90% range
- R +27.6 to R +8.4
- Democratic chance
- 0.1%
- Republican chance
- 99.9%
Error measured out of sample on the 2010 to 2022 elections, with or without polls depending on the race.
Figures are in points of margin between the two candidates. Polls come from Wikipedia and 270toWin; the link goes to the pollster’s document when it is cited.
Illinois
JB Pritzker / Christian Mitchell (D) vs Darren Bailey / Aaron B. Del Mar (R)Chance of winning
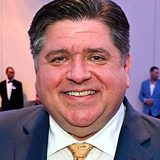 JB Pritzker / Christian Mitchell (D)99.8%
 Darren Bailey / Aaron B. Del Mar (R)0.2%
What drives the forecast
Effect of each element on the expected margin, in points. The total is the forecast margin.
How the forecast has moved
Each candidate's chance of winning, out of 100 (the two add up to 100%). Curve since August 1, recomputed day by day with only the data published at each date.
Two-candidate vote share. Band: 90% range. Curve since August 1, recomputed day by day with only the data published at each date.
Polls used
| Pollster | Field end | D–R |
|---|---|---|
| ActiVote | Oct. 22 | 59–41 |
| Public Policy Polling | Oct. 1 | 54–34 |
From expected margin to probability
- 90% range
- D +6.9 to D +26.2
- Democratic chance
- 99.8%
- Republican chance
- 0.2%
Error measured out of sample on the 2010 to 2022 elections, with or without polls depending on the race.
Figures are in points of margin between the two candidates. Polls come from Wikipedia and 270toWin; the link goes to the pollster’s document when it is cited.
Iowa
Rob Sand (Lt: Dave Muhlbauer) (D) vs Zach Lahn (Lt: Derek Wulf) (R)Chance of winning
 Rob Sand (Lt: Dave Muhlbauer) (D)63.7%
 Zach Lahn (Lt: Derek Wulf) (R)36.3%
What drives the forecast
Effect of each element on the expected margin, in points. The total is the forecast margin.
How the forecast has moved
Each candidate's chance of winning, out of 100 (the two add up to 100%). Curve since August 1, recomputed day by day with only the data published at each date.
Two-candidate vote share. Band: 90% range. Curve since August 1, recomputed day by day with only the data published at each date.
Polls used
| Pollster | Field end | D–R |
|---|---|---|
| co/efficient | Oct. 19 | 49–45 |
| GS Strategy Group/ New River Strategies | Oct. 13 | 54–43 |
| YouGov | Oct. 12 | 50–44 |
| NPA Polling | Oct. 12 | 50–45 |
| Marist University | Oct. 11 | 52–45 |
| Emerson College | Oct. 6 | 49–45 |
| SSRS | Oct. 5 | 51–42 |
| Suffolk University | Oct. 4 | 55–43 |
| New York Times/Siena University | Oct. 1 | 52–41 |
| Beacon Research/ Shaw & Co. Research | Sept. 28 | 53–44 |
| Cygnal | Sept. 11 | 48–44 |
From expected margin to probability
- 90% range
- R +7.6 to D +11.7
- Democratic chance
- 63.7%
- Republican chance
- 36.3%
Error measured out of sample on the 2010 to 2022 elections, with or without polls depending on the race.
Figures are in points of margin between the two candidates. Polls come from Wikipedia and 270toWin; the link goes to the pollster’s document when it is cited.
Kansas
Cindy Holscher / KC Ohaebosim (D) vs Ty Masterson / Jeffrey Klemp (R)Chance of winning
 Ty Masterson / Jeffrey Klemp (R)86.4%
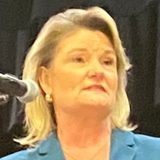 Cindy Holscher / KC Ohaebosim (D)13.6%
What drives the forecast
Effect of each element on the expected margin, in points. The total is the forecast margin.
How the forecast has moved
Each candidate's chance of winning, out of 100 (the two add up to 100%). Curve since August 1, recomputed day by day with only the data published at each date.
Two-candidate vote share. Band: 90% range. Curve since August 1, recomputed day by day with only the data published at each date.
Polls used
| Pollster | Field end | D–R |
|---|---|---|
| Global Strategy Group | Oct. 21 | 47–47 |
| YouGov | Oct. 4 | 44–47 |
| New York Times/Siena University | Sept. 30 | 44–49 |
| Emerson College | Sept. 16 | 44–51 |
| co/efficient | Sept. 10 | 43–51 |
From expected margin to probability
- 90% range
- R +16.0 to D +3.2
- Democratic chance
- 13.6%
- Republican chance
- 86.4%
Error measured out of sample on the 2010 to 2022 elections, with or without polls depending on the race.
Figures are in points of margin between the two candidates. Polls come from Wikipedia and 270toWin; the link goes to the pollster’s document when it is cited.
Maine
Hannah M. Pingree (D) vs Robert B. (Bobby) Charles (R)no probability
Polls used
No poll used for this race.
From expected margin to probability
Race without probability: a ranked-choice contest (Alaska) or one with three serious candidates (Maine) needs a dedicated calculation. The structural centre is given for information.
Figures are in points of margin between the two candidates. Polls come from Wikipedia and 270toWin; the link goes to the pollster’s document when it is cited.
Maryland
Wes Moore / Aruna Miller (D) vs Dan Cox / Rob Krop (R)Chance of winning
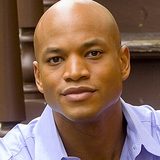 Wes Moore / Aruna Miller (D)100.0%
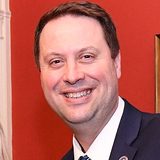 Dan Cox / Rob Krop (R)0.0%
What drives the forecast
Effect of each element on the expected margin, in points. The total is the forecast margin.
How the forecast has moved
Each candidate's chance of winning, out of 100 (the two add up to 100%). Curve since August 1, recomputed day by day with only the data published at each date.
Two-candidate vote share. Band: 90% range. Curve since August 1, recomputed day by day with only the data published at each date.
Polls used
| Pollster | Field end | D–R |
|---|---|---|
| University of Maryland, Baltimore County | Sept. 27 | 51–24 |
From expected margin to probability
- 90% range
- D +16.1 to D +35.3
- Democratic chance
- 100.0%
- Republican chance
- 0.0%
Error measured out of sample on the 2010 to 2022 elections, with or without polls depending on the race.
Figures are in points of margin between the two candidates. Polls come from Wikipedia and 270toWin; the link goes to the pollster’s document when it is cited.
Massachusetts
Maura Healey (D) vs Michael Roger Minogue (R)Chance of winning
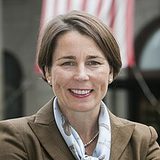 Maura Healey (D)100.0%
Michael Roger Minogue (R)0.0%
What drives the forecast
Effect of each element on the expected margin, in points. The total is the forecast margin.
How the forecast has moved
Each candidate's chance of winning, out of 100 (the two add up to 100%). Curve since August 1, recomputed day by day with only the data published at each date.
Two-candidate vote share. Band: 90% range. Curve since August 1, recomputed day by day with only the data published at each date.
Polls used
| Pollster | Field end | D–R |
|---|---|---|
| Suffolk University | Oct. 18 | 59–36 |
| UMass Amherst/YouGov | Oct. 12 | 56–31 |
| MassINC Polling Group | Sept. 22 | 51–30 |
| University of New Hampshire | Sept. 21 | 54–38 |
From expected margin to probability
- 90% range
- D +12.5 to D +31.8
- Democratic chance
- 100.0%
- Republican chance
- 0.0%
Error measured out of sample on the 2010 to 2022 elections, with or without polls depending on the race.
Figures are in points of margin between the two candidates. Polls come from Wikipedia and 270toWin; the link goes to the pollster’s document when it is cited.
Michigan
Jocelyn Benson / Winnie Brinks (D) vs John James / Jay DeBoyer (R)Chance of winning
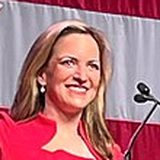 Jocelyn Benson / Winnie Brinks (D)75.5%
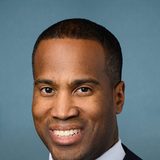 John James / Jay DeBoyer (R)24.5%
What drives the forecast
Effect of each element on the expected margin, in points. The total is the forecast margin.
How the forecast has moved
Each candidate's chance of winning, out of 100 (the two add up to 100%). Curve since August 1, recomputed day by day with only the data published at each date.
Two-candidate vote share. Band: 90% range. Curve since August 1, recomputed day by day with only the data published at each date.
Polls used
| Pollster | Field end | D–R |
|---|---|---|
| Marist University | Oct. 18 | 51–45 |
| Schoen Cooperman Research | Oct. 9 | 30–29 |
| YouGov | Oct. 4 | 48–45 |
| Mitchell Research & Communications | Oct. 1 | 46–39 |
| Z to A Research | Oct. 1 | 50–40 |
| Beacon Research/ Shaw & Co. Research | Sept. 28 | 54–45 |
| Guidant Polling & Strategy | Sept. 27 | 50–45 |
| co/efficient | Sept. 23 | 47–44 |
| New York Times/Siena University | Sept. 22 | 48–43 |
| Beacon Research/ Cygnal | Sept. 21 | 45–38 |
| Suffolk University | Sept. 20 | 51–34 |
| Torchlight Strategies | Sept. 19 | 42–41 |
| Emerson College | Sept. 14 | 49–42 |
| The Washington Post/SSPG | Sept. 14 | 53–41 |
From expected margin to probability
- 90% range
- R +5.6 to D +13.6
- Democratic chance
- 75.5%
- Republican chance
- 24.5%
Error measured out of sample on the 2010 to 2022 elections, with or without polls depending on the race.
Figures are in points of margin between the two candidates. Polls come from Wikipedia and 270toWin; the link goes to the pollster’s document when it is cited.
Minnesota
Amy Klobuchar / Ben Schierer (D) vs Lisa Demuth / Ryan Wilson (R)Chance of winning
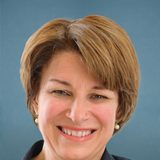 Amy Klobuchar / Ben Schierer (D)79.6%
 Lisa Demuth / Ryan Wilson (R)20.4%
What drives the forecast
Effect of each element on the expected margin, in points. The total is the forecast margin.
How the forecast has moved
Each candidate's chance of winning, out of 100 (the two add up to 100%). Curve since August 1, recomputed day by day with only the data published at each date.
Two-candidate vote share. Band: 90% range. Curve since August 1, recomputed day by day with only the data published at each date.
Polls used
| Pollster | Field end | D–R |
|---|---|---|
| KSTP/SurveyUSA | Oct. 12 | 48–41 |
| Morning Consult | Oct. 9 | 48–39 |
| KARE 11/Minnesota Star Tribune | Oct. 7 | 50–41 |
| co/efficient | Sept. 15 | 47–45 |
From expected margin to probability
- 90% range
- R +4.8 to D +14.4
- Democratic chance
- 79.6%
- Republican chance
- 20.4%
Error measured out of sample on the 2010 to 2022 elections, with or without polls depending on the race.
Figures are in points of margin between the two candidates. Polls come from Wikipedia and 270toWin; the link goes to the pollster’s document when it is cited.
Nebraska
Lynne Walz / Ben Steffen (D) vs Jim Pillen / Joe Kelly (R)Chance of winning
 Jim Pillen / Joe Kelly (R)96.1%
Lynne Walz / Ben Steffen (D)3.9%
What drives the forecast
Effect of each element on the expected margin, in points. The total is the forecast margin.
How the forecast has moved
Each candidate's chance of winning, out of 100 (the two add up to 100%). Curve since August 1, recomputed day by day with only the data published at each date.
Two-candidate vote share. Band: 90% range. Curve since August 1, recomputed day by day with only the data published at each date.
Polls used
| Pollster | Field end | D–R |
|---|---|---|
| National Public Affairs | Oct. 18 | 41–47 |
| Global Strategy Group | Oct. 18 | 39–40 |
| Public Policy Polling | Oct. 14 | 46–48 |
| YouGov | Oct. 3 | 43–44 |
| co/efficient | Sept. 30 | 38–43 |
| Lake Research Partners | Sept. 14 | 40–40 |
| SurveyUSA | Sept. 13 | 35–43 |
From expected margin to probability
- 90% range
- R +19.9 to R +0.7
- Democratic chance
- 3.9%
- Republican chance
- 96.1%
Error measured out of sample on the 2010 to 2022 elections, with or without polls depending on the race.
Figures are in points of margin between the two candidates. Polls come from Wikipedia and 270toWin; the link goes to the pollster’s document when it is cited.
Nevada
Aaron Ford (D) vs Joe Lombardo (R)Chance of winning
 Joe Lombardo (R)85.7%
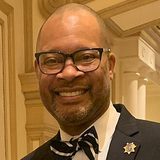 Aaron Ford (D)14.3%
What drives the forecast
Effect of each element on the expected margin, in points. The total is the forecast margin.
How the forecast has moved
Each candidate's chance of winning, out of 100 (the two add up to 100%). Curve since August 1, recomputed day by day with only the data published at each date.
Two-candidate vote share. Band: 90% range. Curve since August 1, recomputed day by day with only the data published at each date.
Polls used
| Pollster | Field end | D–R |
|---|---|---|
| Global Strategy Group | Oct. 13 | 47–48 |
| Noble Predictive Insights | Sept. 26 | 40–42 |
From expected margin to probability
- 90% range
- R +15.8 to D +3.4
- Democratic chance
- 14.3%
- Republican chance
- 85.7%
Error measured out of sample on the 2010 to 2022 elections, with or without polls depending on the race.
Figures are in points of margin between the two candidates. Polls come from Wikipedia and 270toWin; the link goes to the pollster’s document when it is cited.
New Hampshire
Cinde Warmington (D) vs Kelly Ayotte (R)Chance of winning
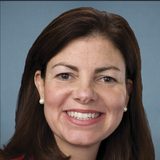 Kelly Ayotte (R)98.3%
Cinde Warmington (D)1.7%
What drives the forecast
Effect of each element on the expected margin, in points. The total is the forecast margin.
How the forecast has moved
Each candidate's chance of winning, out of 100 (the two add up to 100%). Curve since August 1, recomputed day by day with only the data published at each date.
Two-candidate vote share. Band: 90% range. Curve since August 1, recomputed day by day with only the data published at each date.
Polls used
| Pollster | Field end | D–R |
|---|---|---|
| Saint Anselm College | Oct. 20 | 42–50 |
| National Public Affairs | Oct. 12 | 38–54 |
| YouGov | Oct. 5 | 40–49 |
| The New York Times/Siena University | Sept. 22 | 41–52 |
| University of New Hampshire | Sept. 21 | 43–47 |
| co/efficient | Sept. 11 | 34–55 |
From expected margin to probability
- 90% range
- R +22.0 to R +2.8
- Democratic chance
- 1.7%
- Republican chance
- 98.3%
Error measured out of sample on the 2010 to 2022 elections, with or without polls depending on the race.
Figures are in points of margin between the two candidates. Polls come from Wikipedia and 270toWin; the link goes to the pollster’s document when it is cited.
New Mexico
Deb Haaland (D) vs Greggory D. Hull (R)Chance of winning
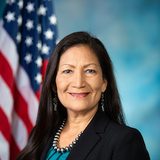 Deb Haaland (D)87.1%
Greggory D. Hull (R)12.9%
What drives the forecast
Effect of each element on the expected margin, in points. The total is the forecast margin.
How the forecast has moved
Each candidate's chance of winning, out of 100 (the two add up to 100%). Curve since August 1, recomputed day by day with only the data published at each date.
Two-candidate vote share. Band: 90% range. Curve since August 1, recomputed day by day with only the data published at each date.
Polls used
| Pollster | Field end | D–R |
|---|---|---|
| Research & Polling Inc. | Oct. 9 | 49–42 |
| SurveyUSA | Sept. 30 | 47–41 |
From expected margin to probability
- 90% range
- R +3.0 to D +16.2
- Democratic chance
- 87.1%
- Republican chance
- 12.9%
Error measured out of sample on the 2010 to 2022 elections, with or without polls depending on the race.
Figures are in points of margin between the two candidates. Polls come from Wikipedia and 270toWin; the link goes to the pollster’s document when it is cited.
New York
Kathy Hochul / Adrienne Adams (lignes Democratic + Working Families) (D) vs Bruce Blakeman / Todd Hood (lignes Republican + Conservative) (R)Chance of winning
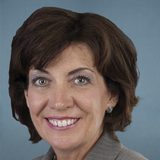 Kathy Hochul / Adrienne Adams (lignes Democratic + Working Families) (D)97.7%
 Bruce Blakeman / Todd Hood (lignes Republican + Conservative) (R)2.3%
What drives the forecast
Effect of each element on the expected margin, in points. The total is the forecast margin.
How the forecast has moved
Each candidate's chance of winning, out of 100 (the two add up to 100%). Curve since August 1, recomputed day by day with only the data published at each date.
Two-candidate vote share. Band: 90% range. Curve since August 1, recomputed day by day with only the data published at each date.
Polls used
| Pollster | Field end | D–R |
|---|---|---|
| Quinnipiac University | Oct. 19 | 55–41 |
| Pollfinity Research | Oct. 12 | 47–44 |
| Beacon Research | Oct. 6 | 53–31 |
| OnMessage Inc. | Oct. 6 | 50–46 |
| Emerson College | Oct. 5 | 52–40 |
| Marist University | Oct. 4 | 53–42 |
| co/efficient | Sept. 25 | 48–41 |
| Siena College | Sept. 17 | 50–41 |
From expected margin to probability
- 90% range
- D +2.1 to D +21.3
- Democratic chance
- 97.7%
- Republican chance
- 2.3%
Error measured out of sample on the 2010 to 2022 elections, with or without polls depending on the race.
Figures are in points of margin between the two candidates. Polls come from Wikipedia and 270toWin; the link goes to the pollster’s document when it is cited.
Ohio
Amy Acton / David Pepper (D) vs Vivek Ramaswamy / Rob McColley (R)Chance of winning
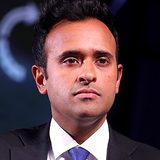 Vivek Ramaswamy / Rob McColley (R)67.8%
 Amy Acton / David Pepper (D)32.2%
What drives the forecast
Effect of each element on the expected margin, in points. The total is the forecast margin.
How the forecast has moved
Each candidate's chance of winning, out of 100 (the two add up to 100%). Curve since August 1, recomputed day by day with only the data published at each date.
Two-candidate vote share. Band: 90% range. Curve since August 1, recomputed day by day with only the data published at each date.
Polls used
| Pollster | Field end | D–R |
|---|---|---|
| Verasight/VoteHub | Oct. 20 | 44–44 |
| ActiVote | Oct. 19 | 49–51 |
| Beacon Research/ Shaw & Co. Research | Oct. 19 | 50–48 |
| Marist University | Oct. 18 | 51–43 |
| GS Strategy Group/New River Strategies | Oct. 13 | 49–44 |
| Bowling Green State University/YouGov | Oct. 9 | 50–44 |
| co/efficient | Oct. 6 | 43–45 |
| SSRS | Oct. 5 | 50–42 |
| New York Times/Siena University | Oct. 1 | 49–45 |
| YouGov | Sept. 30 | 48–44 |
| Big Data Poll | Sept. 27 | 47–48 |
| Suffolk University | Sept. 27 | 50–41 |
From expected margin to probability
- 90% range
- R +12.3 to D +6.9
- Democratic chance
- 32.2%
- Republican chance
- 67.8%
Error measured out of sample on the 2010 to 2022 elections, with or without polls depending on the race.
Figures are in points of margin between the two candidates. Polls come from Wikipedia and 270toWin; the link goes to the pollster’s document when it is cited.
Oklahoma
Cyndi Munson (D) vs Mike Mazzei (R)Chance of winning
 Mike Mazzei (R)99.7%
 Cyndi Munson (D)0.3%
What drives the forecast
Effect of each element on the expected margin, in points. The total is the forecast margin.
How the forecast has moved
Each candidate's chance of winning, out of 100 (the two add up to 100%). Curve since August 1, recomputed day by day with only the data published at each date.
Two-candidate vote share. Band: 90% range. Curve since August 1, recomputed day by day with only the data published at each date.
Polls used
| Pollster | Field end | D–R |
|---|---|---|
| Workbench Strategy | Oct. 13 | 45–49 |
From expected margin to probability
- 90% range
- R +25.8 to R +6.5
- Democratic chance
- 0.3%
- Republican chance
- 99.7%
Error measured out of sample on the 2010 to 2022 elections, with or without polls depending on the race.
Figures are in points of margin between the two candidates. Polls come from Wikipedia and 270toWin; the link goes to the pollster’s document when it is cited.
Oregon
Tina Kotek (D) vs Christine Drazan (R)Chance of winning
 Tina Kotek (D)62.4%
 Christine Drazan (R)37.6%
What drives the forecast
Effect of each element on the expected margin, in points. The total is the forecast margin.
How the forecast has moved
Each candidate's chance of winning, out of 100 (the two add up to 100%). Curve since August 1, recomputed day by day with only the data published at each date.
Two-candidate vote share. Band: 90% range. Curve since August 1, recomputed day by day with only the data published at each date.
Polls used
| Pollster | Field end | D–R |
|---|---|---|
| GBAO | Oct. 4 | 46–42 |
| DHM Research | Oct. 1 | 46–44 |
From expected margin to probability
- 90% range
- R +7.8 to D +11.5
- Democratic chance
- 62.4%
- Republican chance
- 37.6%
Error measured out of sample on the 2010 to 2022 elections, with or without polls depending on the race.
Figures are in points of margin between the two candidates. Polls come from Wikipedia and 270toWin; the link goes to the pollster’s document when it is cited.
Pennsylvania
Josh Shapiro / Austin Davis (D) vs Stacy Garrity / Jason Richey (R)Chance of winning
 Josh Shapiro / Austin Davis (D)100.0%
 Stacy Garrity / Jason Richey (R)0.0%
What drives the forecast
Effect of each element on the expected margin, in points. The total is the forecast margin.
How the forecast has moved
Each candidate's chance of winning, out of 100 (the two add up to 100%). Curve since August 1, recomputed day by day with only the data published at each date.
Two-candidate vote share. Band: 90% range. Curve since August 1, recomputed day by day with only the data published at each date.
Polls used
| Pollster | Field end | D–R |
|---|---|---|
| ActiVote | Oct. 21 | 62–39 |
| Franklin & Marshall College | Oct. 18 | 52–30 |
| PennLive | Oct. 11 | 58–28 |
| Quinnipiac University | Oct. 5 | 59–34 |
| Z to A Research | Oct. 1 | 53–34 |
| Susquehanna Polling & Research | Sept. 30 | 52–31 |
| The New York Times/The Philadelphia Inquirer/Siena University | Sept. 22 | 58–38 |
From expected margin to probability
- 90% range
- D +9.9 to D +29.2
- Democratic chance
- 100.0%
- Republican chance
- 0.0%
Error measured out of sample on the 2010 to 2022 elections, with or without polls depending on the race.
Figures are in points of margin between the two candidates. Polls come from Wikipedia and 270toWin; the link goes to the pollster’s document when it is cited.
Rhode Island
Helena Buonanno Foulkes (D) vs Aaron C. Guckian (R)Chance of winning
 Helena Buonanno Foulkes (D)100.0%
Aaron C. Guckian (R)0.0%
What drives the forecast
Effect of each element on the expected margin, in points. The total is the forecast margin.
How the forecast has moved
Each candidate's chance of winning, out of 100 (the two add up to 100%). Curve since August 1, recomputed day by day with only the data published at each date.
Two-candidate vote share. Band: 90% range. Curve since August 1, recomputed day by day with only the data published at each date.
Polls used
| Pollster | Field end | D–R |
|---|---|---|
| Emerson College/WPRI-TV | Oct. 11 | 44–10 |
| Embold Research | Oct. 8 | 39–17 |
| Opinion Diagnostics | Sept. 25 | 41–19 |
| University of New Hampshire | Sept. 21 | 44–17 |
From expected margin to probability
- 90% range
- D +13.2 to D +32.4
- Democratic chance
- 100.0%
- Republican chance
- 0.0%
Error measured out of sample on the 2010 to 2022 elections, with or without polls depending on the race.
Figures are in points of margin between the two candidates. Polls come from Wikipedia and 270toWin; the link goes to the pollster’s document when it is cited.
South Carolina
Jermaine Johnson (D) vs Alan Wilson (R)Chance of winning
 Alan Wilson (R)98.1%
Jermaine Johnson (D)1.9%
What drives the forecast
Effect of each element on the expected margin, in points. The total is the forecast margin.
How the forecast has moved
Each candidate's chance of winning, out of 100 (the two add up to 100%). Curve since August 1, recomputed day by day with only the data published at each date.
Two-candidate vote share. Band: 90% range. Curve since August 1, recomputed day by day with only the data published at each date.
Polls used
| Pollster | Field end | D–R |
|---|---|---|
| Trafalgar Group | Oct. 18 | 37–53 |
| National Public Affairs | Oct. 16 | 41–51 |
| Resonance Media | Oct. 3 | 35–45 |
From expected margin to probability
- 90% range
- R +21.8 to R +2.6
- Democratic chance
- 1.9%
- Republican chance
- 98.1%
Error measured out of sample on the 2010 to 2022 elections, with or without polls depending on the race.
Figures are in points of margin between the two candidates. Polls come from Wikipedia and 270toWin; the link goes to the pollster’s document when it is cited.
South Dakota
Dan Ahlers / Steven McCleerey (D) vs Larry Rhoden / Tony Venhuizen (R)Chance of winning
 Larry Rhoden / Tony Venhuizen (R)100.0%
Dan Ahlers / Steven McCleerey (D)0.0%
What drives the forecast
Effect of each element on the expected margin, in points. The total is the forecast margin.
How the forecast has moved
Each candidate's chance of winning, out of 100 (the two add up to 100%). Curve since August 1, recomputed day by day with only the data published at each date.
Two-candidate vote share. Band: 90% range. Curve since August 1, recomputed day by day with only the data published at each date.
Polls used
| Pollster | Field end | D–R |
|---|---|---|
| Emerson College | Oct. 22 | 38–56 |
| Mason-Dixon Polling & Strategy | Oct. 14 | 36–56 |
| Concord Public Opinion Partners | Oct. 8 | 38–48 |
From expected margin to probability
- 90% range
- R +36.3 to R +17.1
- Democratic chance
- 0.0%
- Republican chance
- 100.0%
Error measured out of sample on the 2010 to 2022 elections, with or without polls depending on the race.
Figures are in points of margin between the two candidates. Polls come from Wikipedia and 270toWin; the link goes to the pollster’s document when it is cited.
Tennessee
Jerri Green (D) vs Marsha Blackburn (R)Chance of winning
 Marsha Blackburn (R)99.9%
 Jerri Green (D)0.1%
What drives the forecast
Effect of each element on the expected margin, in points. The total is the forecast margin.
How the forecast has moved
Each candidate's chance of winning, out of 100 (the two add up to 100%). Curve since August 1, recomputed day by day with only the data published at each date.
Two-candidate vote share. Band: 90% range. Curve since August 1, recomputed day by day with only the data published at each date.
Polls used
| Pollster | Field end | D–R |
|---|---|---|
| Spry Strategies | Oct. 15 | 32–44 |
| TargetSmart | Sept. 12 | 36–45 |
From expected margin to probability
- 90% range
- R +28.7 to R +9.5
- Democratic chance
- 0.1%
- Republican chance
- 99.9%
Error measured out of sample on the 2010 to 2022 elections, with or without polls depending on the race.
Figures are in points of margin between the two candidates. Polls come from Wikipedia and 270toWin; the link goes to the pollster’s document when it is cited.
Texas
Gina Hinojosa (D) vs Greg Abbott (R)Chance of winning
 Greg Abbott (R)86.6%
 Gina Hinojosa (D)13.4%
What drives the forecast
Effect of each element on the expected margin, in points. The total is the forecast margin.
How the forecast has moved
Each candidate's chance of winning, out of 100 (the two add up to 100%). Curve since August 1, recomputed day by day with only the data published at each date.
Two-candidate vote share. Band: 90% range. Curve since August 1, recomputed day by day with only the data published at each date.
Polls used
| Pollster | Field end | D–R |
|---|---|---|
| ActiVote | Oct. 21 | 48–53 |
| Verasight/VoteHub | Oct. 20 | 44–46 |
| Emerson College | Oct. 19 | 45–49 |
| Beacon Research/ Shaw & Co. Research | Oct. 19 | 47–52 |
| Texas Public Opinion Research | Oct. 18 | 48–51 |
| Pollfinity Research | Oct. 18 | 45–46 |
| CBS News/YouGov | Oct. 16 | 48–52 |
| University of Houston | Oct. 14 | 46–49 |
| GS Strategy Group/New River Strategies | Oct. 13 | 46–48 |
| Marist University | Oct. 11 | 45–49 |
| ReconMR/Siena University | Oct. 8 | 47–48 |
| GBAO | Oct. 8 | 47–45 |
| University of Texas/Texas Politics Project | Oct. 5 | 49–48 |
| YouGov | Oct. 5 | 48–47 |
| New York Times/Siena University | Oct. 1 | 49–46 |
| Guidant Polling & Strategy | Sept. 28 | 44–46 |
| UMass Lowell/YouGov | Sept. 28 | 44–48 |
| Big Data Poll | Sept. 26 | 44–47 |
| Stratus Intelligence | Sept. 24 | 45–50 |
| Texas Southern University | Sept. 19 | 45–49 |
| Mason-Dixon | Sept. 10 | 41–48 |
From expected margin to probability
- 90% range
- R +16.1 to D +3.1
- Democratic chance
- 13.4%
- Republican chance
- 86.6%
Error measured out of sample on the 2010 to 2022 elections, with or without polls depending on the race.
Figures are in points of margin between the two candidates. Polls come from Wikipedia and 270toWin; the link goes to the pollster’s document when it is cited.
Vermont
Amanda Janoo (D) vs Phil Scott (R)Chance of winning
 Phil Scott (R)79.7%
 Amanda Janoo (D)20.3%
What drives the forecast
Effect of each element on the expected margin, in points. The total is the forecast margin.
How the forecast has moved
Each candidate's chance of winning, out of 100 (the two add up to 100%). Curve since August 1, recomputed day by day with only the data published at each date.
Two-candidate vote share. Band: 90% range. Curve since August 1, recomputed day by day with only the data published at each date.
Polls used
| Pollster | Field end | D–R |
|---|---|---|
| State Navigate | Oct. 4 | 41–43 |
| Braun Research/Vermont Public | Sept. 21 | 32–42 |
| University of New Hampshire | Sept. 21 | 49–43 |
From expected margin to probability
- 90% range
- R +14.5 to D +4.8
- Democratic chance
- 20.3%
- Republican chance
- 79.7%
Error measured out of sample on the 2010 to 2022 elections, with or without polls depending on the race.
Figures are in points of margin between the two candidates. Polls come from Wikipedia and 270toWin; the link goes to the pollster’s document when it is cited.
Wisconsin
David Crowley / Sarah Godlewski (D) vs Tom Tiffany / David Varnam (R)Chance of winning
 David Crowley / Sarah Godlewski (D)50.8%
 Tom Tiffany / David Varnam (R)49.2%
What drives the forecast
Effect of each element on the expected margin, in points. The total is the forecast margin.
How the forecast has moved
Each candidate's chance of winning, out of 100 (the two add up to 100%). Curve since August 1, recomputed day by day with only the data published at each date.
Two-candidate vote share. Band: 90% range. Curve since August 1, recomputed day by day with only the data published at each date.
Polls used
| Pollster | Field end | D–R |
|---|---|---|
| YouGov | Oct. 9 | 46–42 |
| Z to A Research | Oct. 1 | 49–44 |
| Marquette University | Sept. 23 | 49–46 |
From expected margin to probability
- 90% range
- R +9.5 to D +9.7
- Democratic chance
- 50.8%
- Republican chance
- 49.2%
Error measured out of sample on the 2010 to 2022 elections, with or without polls depending on the race.
Figures are in points of margin between the two candidates. Polls come from Wikipedia and 270toWin; the link goes to the pollster’s document when it is cited.
Wyoming
Kenneth R. Casner (D) vs Eric Barlow (R)Chance of winning
Eric Barlow (R)99.7%
Kenneth R. Casner (D)0.3%
What drives the forecast
Effect of each element on the expected margin, in points. The total is the forecast margin.
How the forecast has moved
Each candidate's chance of winning, out of 100 (the two add up to 100%). Curve since August 1, recomputed day by day with only the data published at each date.
Two-candidate vote share. Band: 90% range. Curve since August 1, recomputed day by day with only the data published at each date.
Polls used
No poll used for this race.
From expected margin to probability
- 90% range
- R +58.5 to R +14.9
- Democratic chance
- 0.3%
- Republican chance
- 99.7%
Error measured out of sample on the 2010 to 2022 elections, with or without polls depending on the race.
Figures are in points of margin between the two candidates. Polls come from Wikipedia and 270toWin; the link goes to the pollster’s document when it is cited.
Method
How the forecast is built
Likely-voter generic ballot, the same average as for the House, recalculated daily: D +6.9 points today.
Race polls count at every date, and more as the vote nears: 68% of the centre two months out, 76% one month out, 88% on election day. These weights are learned on 2010 to 2022. Without a poll in the last 45 days, structure only.
Each race’s uncertainty is measured on past elections; it is smaller when the race has polls. Races are simulated independently: the four-election test did not retain a shared national shock.
Poll bias correction. In the 2006 to 2022 midterms, polls overstated Democrats every time. The average gap depends on the distance to election day: 2.95 points a month out, 2.26 on the eve. The model takes off every poll (generic ballot, race and district polls) the gap matching today's date: 2.49 points today.
What the method gave on past elections
Out-of-sample test on the 144 governor races of 2010, 2014, 2018 and 2022, at several dates before the vote: for each year, the model learns only from the others. Rule used: structure and polls blended, weight learned by horizon.
| Test date | Mean error | Root mean square error | Winner called |
|---|---|---|---|
| 45 days before the vote | 6.66 | 9.85 | 86.8% |
| 30 days before the vote | 5.77 | 8.04 | 91.0% |
| 21 days before the vote | 5.31 | 7.34 | 89.6% |
| 7 days before the vote | 3.94 | 5.42 | 91.7% |
| Election day (latest polls) | 3.71 | 5.23 | 93.8% |
Limits
- Alaska and Maine get no probability.
- Races are independent of one another and of the Senate and House; no joint probability is measured.
- Polls come from secondary sources; checking against the pollster’s document is manual.
Sources
Where the data come from
Wikipedia and 270toWin, collected daily, with the link to the pollster’s document when it is cited. Polls taken into account up to October 24, 2026.
2024 presidential vote by state: certified results (FEC). Generic ballot: average of national polls (Wikipedia, PollsMax). Governor results 2010 to 2022 for estimation and tests.
Officially nominated candidates, incumbent governor status and last result for each governorship, checked race by race.
Party symbols. The donkey and the elephant are the symbols of the Democratic and Republican parties (Wikimedia Commons files). Used for identification; no affiliation.
Pollsters used (101 pollsters, number of races polled)
- co/efficient10
- YouGov10
- Emerson College8
- ActiVote7
- Marist University5
- New York Times/Siena University5
- University of New Hampshire5
- Beacon Research/ Shaw & Co. Research4
- Suffolk University4
- Big Data Poll3
- Global Strategy Group3
- National Public Affairs3
- Quinnipiac University3
- SurveyUSA3
- Z to A Research3
- Cygnal2
- GBAO2
- GS Strategy Group/New River Strategies2
- Guidant Polling & Strategy2
- Mason-Dixon2
- Pollfinity Research2
- Public Policy Polling2
- SSRS2
- Verasight/VoteHub2
- Advanced Targeting Research1
- Beacon Research1
- Beacon Research/ Cygnal1
- Berkeley IGS1
- Bowling Green State University/YouGov1
- Braun Research/Vermont Public1
- BSP Research1
- CBS News/YouGov1
- Change Research1
- Concord Public Opinion Partners1
- DHM Research1
- Embold Research1
- Emerson College/WPRI-TV1
- Equis Research1
- Fabrizio, Lee & Associates1
- Franklin & Marshall College1
- GQR1
- GrayHouse1
- GreatBlue Research1
- GS Strategy Group/ New River Strategies1
- Hendrix College1
- HighGround, Inc.1
- Independent Voter Project1
- InsiderAdvantage1
- KARE 11/Minnesota Star Tribune1
- KSTP/SurveyUSA1
- Lake Research Partners1
- Manhattan Institute1
- Marquette University1
- Mason-Dixon Polling & Strategy1
- MassINC Polling Group1
- MDW Communications1
- Mitchell Research & Communications1
- Morning Consult1
- Noble Predictive Insights1
- NPA Polling1
- OnMessage Inc.1
- Opinion Diagnostics1
- PennLive1
- PPIC1
- Quantus Insights1
- Rasmussen Reports1
- ReconMR/Siena University1
- Research & Polling Inc.1
- Resonance Media1
- RMG Research1
- Saint Anselm College1
- Schoen Cooperman Research1
- Siena College1
- Spry Strategies1
- St. Pete Polls1
- State Navigate1
- Stetson University1
- Stratus Intelligence1
- Susquehanna Polling & Research1
- TargetSmart1
- Targoz Market Research1
- Texas Public Opinion Research1
- Texas Southern University1
- The Alabama Poll1
- The New York Times/Siena University1
- The New York Times/The Philadelphia Inquirer/Siena University1
- The Washington Post/SSPG1
- Torchlight Strategies1
- Trafalgar Group1
- UC Berkeley Citrin Center/TrueDot/Politico1
- UMass Amherst/YouGov1
- UMass Lowell/YouGov1
- University of Georgia1
- University of Houston1
- University of Maryland, Baltimore County1
- University of North Florida1
- University of Texas/Texas Politics Project1
- Univision/YouGov1
- Wesleyan University/YouGov1
- Wick1
- Workbench Strategy1
Links to the 167 poll documents
http://texaspolitics.utexas.edu/blog/latest-ut-texas-politics-poll-finds-historic-levels-of-competition-in-texas-midterm-electionshttps://azhighground.com/hurricane-season-for-arizona-republicans/https://backend.natpublicaffairs.com/media/Iowa_General_Election_Memo_101526.3.pdfhttps://backend.natpublicaffairs.com/media/NE_Tracker_R2_Trend_Memo_102226.7.pdfhttps://backend.natpublicaffairs.com/media/NH_General_Election_Memo_101526.2.pdfhttps://battlegrounds.coefficient.org/fl/https://battlegrounds.coefficient.org/ia/https://battlegrounds.coefficient.org/ks/https://battlegrounds.coefficient.org/mi/https://battlegrounds.coefficient.org/mn/https://battlegrounds.coefficient.org/ne/https://battlegrounds.coefficient.org/nh/https://battlegrounds.coefficient.org/oh/https://bravogroup.us/morning-scrapple/https://cdn.votehub.com/pdfs/VoteHub_Verasight_Oct_2026_Ohio_Report_D1CB7735.pdfhttps://cdn.votehub.com/pdfs/VoteHub_Verasight_Oct_2026_Texas_Report_D8A925D0.pdfhttps://changeresearch.com/research/2026/2026-10-12-florida-aapor-methodology-statementhttps://cityforwardcollective.org/new-wisconsin-poll-wisconsinites-back-public-school-options-and-equal-accountability/https://coefficient.org/our-work/connecticut-governor-general-election-sep-2026/https://commonwealthbeacon.org/politics/poll-healey-cruising-in-reelection-bid-with-trump-high-on-voters-mind/https://d3nkl3psvxxpe9.cloudfront.net/documents/ttw_fl_20260921_lv.pdfhttps://d3nkl3psvxxpe9.cloudfront.net/documents/ttw_ga_20260915.pdfhttps://d3nkl3psvxxpe9.cloudfront.net/documents/ttw_ia_20261006_lv.pdfhttps://d3nkl3psvxxpe9.cloudfront.net/documents/ttw_ks_20260921_lv.pdfhttps://d3nkl3psvxxpe9.cloudfront.net/documents/ttw_mi_20260921_lv.pdfhttps://d3nkl3psvxxpe9.cloudfront.net/documents/ttw_ne_20260921_lv.pdfhttps://d3nkl3psvxxpe9.cloudfront.net/documents/ttw_nh_20260921_lv.pdfhttps://d3nkl3psvxxpe9.cloudfront.net/documents/ttw_oh_20260921_lv.pdfhttps://d3nkl3psvxxpe9.cloudfront.net/documents/ttw_tx_20260921_lv.pdfhttps://data.ddhq.io/polls/2026/10/08/GQR-Arizonahttps://data.ddhq.io/polls/2026/10/19/Global-Strategy-Group/Aaron-Ford-Nevada-2026-10-08-2026-10-13https://data.ddhq.io/polls/2026/10/23/GrayHouse-Arizonahttps://drive.google.com/file/d/1e2r7nm_omQkzU9N5XySW6BidnadoY3vB/viewhttps://drive.google.com/file/d/1ym0Wv6bIEaTDRzmS-KSMMAXDvx_7zcYu/viewhttps://emersoncollegepolling.com/california-2026-poll-xavier-becerra-holds-27-point-lead-over-steve-hilton/https://emersoncollegepolling.com/connecticut-2026-poll-ned-lamont-holds-13-point-lead-over-ryan-fazio/https://emersoncollegepolling.com/iowa-2026-poll-u-s-senate-race-tightens-sand-maintains-edge-for-governor/https://emersoncollegepolling.com/kansas-2026/https://emersoncollegepolling.com/michigan-2026-poll-el-sayed-and-rogers-locked-in-close-election/https://emersoncollegepolling.com/new-york-2026-poll-governor-hochul-leads-blakeman-by-12/https://emersoncollegepolling.com/texas-2026-poll-toss-up/https://enjoyer.com/michigan-poll-fall-2026/https://floridapolitics.com/archives/824726-poll-byron-donalds-up-6-over-david-jolly-with-3-weeks-until-election-day/https://ginafortexas.com/wp-content/uploads/2026/10/TX-Gov-Poll-Memo-101226.pdfhttps://globalstrategygroup.app.box.com/s/vwojuwfb4y52lmvw4r5c5b60svfyrmqchttps://itrfoundation.org/wp-content/uploads/2026/09/ITR-Foundation-Poll-Toplines-09-11-2026.pdfhttps://ivn.us/new-ca-poll-voter-id-measure-leads-today-its-undecided-voters-point-the-other-way/https://jamesmadison.org/wp-content/uploads/JMI-October-2026-Poll-Marginals.pdfhttps://jamesmagazinega.com/2026/10/14/georgia-governors-poll-from-insideradvantage-jackson-maintains-slight-edge/https://journalstar.com/news/state-regional/government-politics/article_7517739e-8b45-53fc-a3be-81783361c874.htmlhttps://kstp.com/kstp-news/top-news/kstp-surveyusa-poll-swing-in-senate-and-ag-races-klobuchar-up-slightly-on-demuth/https://law.marquette.edu/poll/2026/09/30/mlsp91-press-release/https://manhattan.institute/article/californias-contradictions-survey-analysis-of-2026-voter-preferences-statewide-and-in-los-angeleshttps://maristpoll.marist.edu/wp-content/uploads/2026/10/Marist-Poll_Iowa_NOS-and-Tables_202610131230@3bcy%5Ew.pdfhttps://maristpoll.marist.edu/wp-content/uploads/2026/10/Marist-Poll_MI-NOS-and-Tables_202610191238FFx09@Jal.pdfhttps://maristpoll.marist.edu/wp-content/uploads/2026/10/Marist-Poll_NYS_NOS-and-Tables_202610051034565bVw9_q.pdfhttps://maristpoll.marist.edu/wp-content/uploads/2026/10/Marist-Poll_OH-NOS-and-Tables_202610191215zz9hjdV2l.pdfhttps://maristpoll.marist.edu/wp-content/uploads/2026/10/Marist-Poll_TX-NOS-and-Tables_202610131056%5Eal3j7.pdfhttps://nypost.com/2026/10/05/us-news/more-than-half-of-new-york-voters-concerned-about-rise-of-socialism-poll/https://nypost.com/2026/10/20/us-news/hochul-leads-blakeman-by-only-4-points-in-ny-governors-race-gop-internal-poll-claims/https://omaha.com/news/state-regional/government-politics/elections/article_7261e7ba-664d-4d70-8e0e-5655e663f593.htmlhttps://politics.umbc.edu/wp-content/uploads/sites/778/2026/10/UMBC-Poll-Tuesday-Oct-6.pdfhttps://poll.qu.edu/images/polling/pa/pa10072026_pgrx47.pdfhttps://poll.qu.edu/poll-release?releaseid=3971https://poll.qu.edu/poll-release?releaseid=3972https://pollfinity.com/polls/ny-governor-2026-octhttps://pollfinity.com/polls/tx-governor-senate-2026-octhttps://projects.statenavigate.com/interactives/vt/statewide-poll-october-2026/#governorhttps://reconmr.com/wp-content/uploads/2026/10/TXP004-October-Press-Release.pdfhttps://results.surveyusa.com/client/PollReport.aspx?g=aa444494-3077-4ad2-a8ef-df17241474c5https://results.surveyusa.com/client/PollReport.aspx?g=d94236a7-5861-4b7f-9d81-d5a81ab786cchttps://s3.documentcloud.org/documents/28623723/tx926allvoterresults.pdfhttps://s3.documentcloud.org/documents/28724874/fl1026results.pdfhttps://s3.documentcloud.org/documents/28821730/shu-ct-gubernatorial-race-poll-3-of-3.pdfhttps://salve.edu/documents/pell-center-vov-october-2026-reporthttps://scholars.unh.edu/cgi/viewcontent.cgi?article=2004&context=survey_center_pollshttps://scholars.unh.edu/cgi/viewcontent.cgi?article=2005&context=survey_center_pollshttps://scholars.unh.edu/cgi/viewcontent.cgi?article=2007&context=survey_center_pollshttps://scholars.unh.edu/cgi/viewcontent.cgi?article=2009&context=survey_center_pollshttps://scholars.unh.edu/survey_center_polls/1009/https://scholarworks.bgsu.edu/cgi/viewcontent.cgi?article=1028&context=depohttps://sri.siena.edu/2026/09/23/siena-poll-of-likely-new-york-state-voters-hochul-50-blakeman-41/https://st1.uvnimg.com/65/9b/a8b15584426684070c3d05cf6e34/n-univision-florida-poll-crosstabs-base-final.pdfhttps://static.foxnews.com/foxnews.com/content/uploads/2026/10/fox_october-15-19-2026_ohio_topline_october-21-release.pdfhttps://static.foxnews.com/foxnews.com/content/uploads/2026/10/fox_october-15-19-2026_texas_topline_october-21-release.pdfhttps://static01.nyt.com/newsgraphics/documenttools/517739e11050c66b/43ffa3c2-full.pdfhttps://static01.nyt.com/newsgraphics/documenttools/b31cf2744465b8b7/1a8b655b-full.pdfhttps://static1.squarespace.com/static/5f14ae6fb2a20e01e9c6d608/t/6ac5723418810b6ec90c70b7/1791324724665/Mitchell+MI+Poll+GOVERNOR+Press+Release+5PM+10-6-26_A.pdfhttps://static1.squarespace.com/static/67aa7aa3e284b002cd6a420e/t/6ab15cb39e4cc420b9ef07f5/1790008500236/TSUSept2026_TXStatewideRaces.pdfhttps://static1.squarespace.com/static/6994d571bce3436c60d86870/t/6ad8a5ec13c20404a1f8052b/1792583148294/UNF+PORL+FALL+Statewide+2026+FLLV+-+Press+Release+1021+EMBARGO.pdfhttps://static1.squarespace.com/static/6a5f8cee70d79f7c81148115/t/6aac27e65ceec94e215a260b/1789667303333/TSmart_TN+Statewide+Baseline_Toplines_2026.09.14.pdfhttps://surveylab.wescreates.wesleyan.edu/wp-content/uploads/2026/10/ToplinesforWeb.pdfhttps://talkbusiness.net/2026/10/poll-gov-sanders-stretches-lead-over-two-opponents-shelby-support-grows/https://texaspublicopinionresearch.substack.com/p/october-poll-in-texas-general-electionhttps://washingtonreporter.news/exclusive-mike-rogers-leads-in-michigan-john-james-nearly-tied-poll-shows/https://wick.io/research-arizona-governor-survey-october-2026https://www.abqjournal.com/news/journal-poll-haaland-maintains-lead-over-hull-as-new-mexicos-race-for-governor-nears-homestretch/3139307https://www.activote.net/polls/2026/ca-governor/2026-10-16/https://www.activote.net/polls/2026/fl-governor/https://www.activote.net/polls/2026/ga-governor/https://www.activote.net/polls/2026/il-governor/2026-10-22/https://www.activote.net/polls/2026/oh-governor/https://www.activote.net/polls/2026/pa-governor/2026-10-21/https://www.activote.net/polls/2026/tx-governor/https://www.advancedtargetingresearch.com/_files/ugd/03a624_0fca9a6dd7f846f7bc96f97429561064.pdfhttps://www.al.com/politics/2026/10/gop-faces-election-downturn-but-theres-no-blue-wave-for-alabama-democrats-poll-shows.htmlhttps://www.anselm.edu/about/anselmian-hub/news/new-saint-anselm-college-poll-finds-democrats-leading-congressional-races-affordability-concerns-shape-election-landscapehttps://www.bigdatapoll.com/blog/buckeye-state-poll-sherrod-brown-leads-jon-husted-for-us-senate-in-ohio/https://www.bigdatapoll.com/blog/lone-star-state-poll-talarico-paxton-in-close-race-us-senate-in-texas/https://www.bigdatapoll.com/blog/peach-state-poll-jon-ossoff-opens-up-lead-over-mike-collins-in-georgia/https://www.cbsnews.com/news/texas-senate-talarico-paxton-poll/https://www.cnwmedia.com/article/cnw-poll-pritzker-leads-bailey-by-20-points-democrats-ahead-in-four-other-statewide-raceshttps://www.cookpolitical.com/analysis/survey-research/battleground-district-project/senate-battleground-district-project-octoberhttps://www.documentcloud.org/documents/28729016-cnn-ohio-poll-conducted-by-ssrs/https://www.documentcloud.org/documents/28729018-cnn-iowa-poll-conducted-by-ssrs/https://www.documentcloud.org/documents/28817212-sd-sen-gov-concord-public-opinion-partners-oct-2026/https://www.dropbox.com/scl/fi/zw2q5gxws1dl59v9d9ivy/Crosstabs-full-sample-ASU-Svy-August-2026.pdf?rlkey=288kk2u0s27qzprjom3l32t16&st=dautaf2c&e=2&dl=0https://www.fandmpoll.org/franklin-marshall-college-poll-release-october-2026/https://www.fitsnews.com/wp-content/uploads/securepdfs/2026/10/Resonance-Governor-Poll-Summary-Oct-5-2026.pdfhttps://www.fitsnews.com/wp-content/uploads/securepdfs/2026/10/SC_Governor_Memo_102026.pdfhttps://www.foxnews.com/politics/fox-news-poll-michigan-voters-split-between-el-sayed-rogershttps://www.foxnews.com/politics/fox-news-poll-turek-hinson-close-iowa-senate-racehttps://www.golocalprov.com/politics/new-blocks-campaign-poll-shows-he-leads-foulkes-head-to-head-in-race-for-gov-guckian-on-track-for-the-worst-gop-result-on-recordhttps://www.keloland.com/keloland-com-original/keloland-poll-rounds-leads-bengs-at-8-trump-approval-down/amp/https://www.kob.com/new-mexico/kob-poll-finds-haaland-leading-hull-by-6-points-in-head-to-head-race/https://www.latimes.com/california/story/2026-09-24/high-cost-of-living-tops-voter-concerns-becerra-remains-front-runner-in-governors-race-new-poll-showshttps://www.mdwcomm.com/media/florida-statewide-poll-october-2026.htmlhttps://www.noblepredictiveinsights.com/post/lombardo-tries-to-escape-trump-s-orbit-up-2-over-fordhttps://www.nytimes.com/2026/09/25/us/governor-polls-maine-michigan-new-hampshire-pennsylvania.htmlhttps://www.nytimes.com/interactive/2026/09/24/polls/times-inquirer-siena-pa-poll-lv-crosstabs.htmlhttps://www.nytimes.com/interactive/2026/09/25/polls/times-siena-poll-nh-crosstabs.htmlhttps://www.nytimes.com/interactive/2026/10/03/polls/times-siena-iowa-poll-toplines.htmlhttps://www.nytimes.com/interactive/2026/10/03/polls/times-siena-kansas-poll-toplines.htmlhttps://www.nytimes.com/interactive/2026/10/03/polls/times-siena-ohio-poll-crosstabs.htmlhttps://www.nytimes.com/interactive/2026/10/03/polls/times-siena-texas-poll-toplines.htmlhttps://www.opb.org/article/2026/10/08/new-polls-kotek-may-lead/https://www.oregonlive.com/politics/2026/10/oregon-governors-race-may-be-shifting-new-poll-shows.htmlhttps://www.politico.com/f/?id=0000019a-141e-dc69-abda-fedeff110000https://www.politico.com/f/?id=000001a0-e76b-d462-adb2-e7fba4200000https://www.politico.com/f/?id=000001a1-3bf3-d058-adf3-3bfb56120000https://www.politico.com/f/?id=000001a1-5b43-df3a-afab-df5b7c8e0000https://www.politico.com/news/2026/10/20/democrats-make-a-play-for-oklahoma-after-bitter-gop-gubernatorial-primary-01127523https://www.ppic.org/publication/ppic-statewide-survey-californians-and-their-government-september-2026/https://www.rasmussenreports.com/public_content/politics/elections/election_2026/election_2026_georgia_governorhttps://www.sdnewswatch.org/south-dakota-poll-2026-governor-ahlers-rhoden/https://www.spryresearch.com/post/tennessee-statewide-survey-october-2026https://www.startribune.com/minnesota-poll-klobuchar-demuth-governor/601887444https://www.stetson.edu/artsci/cpor/media/cpor-fall-2026-report-wave-2-october.pdfhttps://www.stpetepolls.org/files/StPetePolls_2026_State_Gov_October7_K7ZU3GA.pdfhttps://www.suffolk.edu/-/media/suffolk/documents/academics/research-at-suffolk/suprc/polls/massachusetts2/2026/10_20_2026_massachusetts_statewide_marginals.pdf?la=en&hash=12AC3ACF484DC216ED83A879BAF0781ACEA5FC89https://www.suffolk.edu/-/media/suffolk/documents/academics/research-at-suffolk/suprc/polls/other-states/2026/10_7_2026_iowa_statewide_marginals.pdf?la=en&hash=2D72AC4AC373F8C2FA39466A7E5CD59D2370B6F9https://www.suffolk.edu/-/media/suffolk/documents/academics/research-at-suffolk/suprc/polls/other-states/2026/9_22_2026_michigan_statewide_marginals.pdf?la=en&hash=6738E3056D284CD6D4733F5FB9C38684431D4884https://www.suffolk.edu/-/media/suffolk/documents/academics/research-at-suffolk/suprc/polls/other-states/2026/9_29_2026_ohio_embargoed_marginals_part_1.pdfhttps://www.thedailyagenda.com/p/morning-take-the-daily-agenda-pollhttps://www.thetrafalgargroup.org/wp-content/uploads/2026/10/SC-Midterms-Survey-Report-1020.pdfhttps://www.uh.edu/hobby/texas2026/index.phphttps://www.umass.edu/poll/about/reports/2026-10-massachusetts-public-opinion-pollhttps://www.uml.edu/news/press-releases/2026/10092026-texas-poll.aspxhttps://www.vermontpublic.org/local-news/2026-09-28/vermont-general-election-poll-results-2026https://www.washingtonpost.com/documents/08fa9b5e-43ac-456c-a706-4c33ec6506dc.pdf?itid=lk_inline_manual_2https://www.wbrc.com/2026/10/20/tuberville-leads-jones-51-40-percent-exclusive-gray-alabama-daily-news-poll/https://www.weareequis.us/research/memo-arizona-voter-research---sept-2026https://www.wpri.com/12-news-emerson-college-poll-results-october-2026/https://www.wsbtv.com/news/local/ajcuga-poll-bottoms-jackson-dead-heat-georgia-governor-race/76TN3NROXRG4HDILVYDUMJS4RQ/https://x.com/SusquehannaPR/status/2107848814992449714https://x.com/rbrtraining/status/2108302504446337272https://yellowhammernews.com/report-doug-jones-is-polling-worse-than-2020-blowout-election/
A forecast, not a certainty
Figures are recalculated every day with the published polls. Latest calculation: October 24, 2026.
A race given at 70% is lost by the favourite three times in ten.