Each pollster counts once, with its latest poll. That poll is weighted by its age, its sample size and the pollster’s past accuracy, measured on the 2010-2022 elections. A poll commissioned by a party, a candidate or an allied group is corrected by the average gap between such polls and independent ones.
CARTE
Map of the 35 races
EXPLORE THE RACES3 vues · same selection
National view 50 States · 35 races
Tab moves through the states. Enter opens the sheet. The three views keep the selection. +/− zooms; “Frame” centers the race. “Pan” enables moving with the mouse or finger. Escape closes full screen.
Republican favouredToss-upDemocrat or allied independent favouredNo election in 2026
National simulation
How many seats for each side
Each bar gives the probability of a seat count, across 200,000 simulations of the election. Blue: outcomes where the Democrats and their allies hold the Senate. Red: outcomes where the Republicans keep it.
Latest update, October 24 | The Democrats' chance of controlling the Senate stays at 31%. Biggest moves: Mississippi, Scott Colom (D 1% → 3%, on the national environment alone) ; Iowa, Josh Turek (D 27% → 26%, on the national environment alone).
49.3expected seats for Democrats and allied independents · 9 in 10 chance between 46 and 5350.7expected seats for Republicans · 9 in 10 chance between 47 and 54Democratic majority in 29.7% of the 200,000 simulations; Republican in 70.3%.
Seats by level of certainty
Safe899%+
Very likely385-99%
Likely265-85%
Uncertain3under 65%
Likely465-85%
Very likely885-99%
Safe799%+
9 competitive races (under 85%)
34 D and 31 R seats not up
Close races
The races that will decide the Senate
The 5 races where each side keeps at least a one-in-four chance, from closest to least close. The expected margin is the centre of the forecast, in points; the bar gives each candidate’s chance of winning.
The races that decide the Senate
Of the 35 seats up, most are not competitive. Control comes down to a handful of races, mostly Republican-held seats.
Currently Dem
Democrats need to hold these seats
Currently Rep
and gain 4 of these to win a majority
TexasREGULAR SEAT
 James Talarico (D)Ken Paxton (R)

45%55%
Expected margin: R +0.9
Poll average: D +3.4 (30 polls, latest October 21)
Last election (2020): R +9.6
Poll average: D +3.4 (30 polls, latest October 21)
Last election (2020): R +9.6
MaineREGULAR SEAT
Troy D. Jackson (D)Susan M. Collins (R)43%57%
Expected margin: R +1.3
Poll average: D +0.8 (19 polls, latest October 20)
Last election (2020): R +8.6
Poll average: D +0.8 (19 polls, latest October 20)
Last election (2020): R +8.6
MichiganREGULAR SEAT
Abdul El-Sayed (D)Mike Rogers (R)60%40%
Expected margin: D +1.8
Poll average: D +4.0 (28 polls, latest October 22)
Last election (2020): D +1.7
Poll average: D +4.0 (28 polls, latest October 22)
Last election (2020): D +1.7
MinnesotaREGULAR SEAT
Peggy Flanagan (D)Michele Tafoya (R)73%27%
Expected margin: D +4.6
Poll average: D +4.6 (13 polls, latest October 21)
Last election (2020): D +5.2
Poll average: D +4.6 (13 polls, latest October 21)
Last election (2020): D +5.2
IowaREGULAR SEAT
Josh Turek (D)Ashley Hinson (R)26%74%
Expected margin: R +4.6
Poll average: R +0.7 (17 polls, latest October 22)
Last election (2020): R +6.6
Poll average: R +0.7 (17 polls, latest October 22)
Last election (2020): R +6.6
The 35 races
Every race, from most Democratic to most Republican
The chance shown is the favourite’s. The expected margin is the centre of the forecast, with the range that holds the result 9 times out of 10. The poll average weights each poll by its age, its sample and the pollster’s past accuracy. “Flip” marks a seat whose favourite is not the party that won it last time.
| State | Chance of winning | Expected margin |
|---|---|---|
| MassachusettsRegular seatEdward J. Markey / John Deaton | >99%D chance | D +31.9D +20 to D +44 |
| DelawareRegular seatChris Coons / Michael "Dr. Mike" Katz | >99%D chance | D +35.8D +22 to D +50 |
| ColoradoRegular seatJohn Hickenlooper / Mark Baisley | >99%D chance | D +29.0D +17 to D +41 |
| Rhode IslandRegular seatJohn F. Reed / Raymond T. McKay | >99%D chance | D +28.0D +16 to D +40 |
| New JerseyRegular seatCory Booker / Justin Murphy | >99%D chance | D +32.5D +18 to D +47 |
| OregonRegular seatJeff Merkley / David Brock Smith | >99%D chance | D +32.2D +18 to D +46 |
| VirginiaRegular seatMark R. Warner / Bert Mizusawa | >99%D chance | D +24.1D +12 to D +36 |
| New MexicoRegular seatBen R. Luján / Larry E. Marker (write-in primaire R) | >99%D chance | D +19.2D +7 to D +31 |
| IllinoisRegular seatJuliana Stratton / Don Tracy | 96%D chance | D +15.4D +1 to D +30 |
| GeorgiaRegular seatJon Ossoff / Mike Collins | 91%D chance | D +10.0R +2 to D +22 |
| North Carolina flipRegular seatRoy Cooper / Michael Whatley | 85%D chance | D +7.6R +4 to D +20 |
| New HampshireRegular seatChris Pappas / John E. Sununu | 77%D chance | D +5.3R +7 to D +17 |
| MinnesotaRegular seatPeggy Flanagan / Michele Tafoya | 73%D chance | D +4.6R +7 to D +17 |
| MichiganRegular seatAbdul El-Sayed / Mike Rogers | 60%D chance | D +1.8R +10 to D +14 |
| TexasRegular seatJames Talarico / Ken Paxton | 55%R chance | R +0.9R +13 to D +11 |
| MaineRegular seatTroy D. Jackson / Susan M. Collins | 57%R chance | R +1.3R +13 to D +11 |
| IowaRegular seatJosh Turek / Ashley Hinson | 74%R chance | R +4.6R +17 to D +7 |
| NebraskaRegular seatDan Osborn / Pete Ricketts | 76%R chance | R +8.3R +28 to I +12 |
| OhioSpecial electionSherrod Brown / Jon Husted | 76%R chance | R +5.1R +17 to D +7 |
| AlaskaRegular seatMary Peltola / Dan S. Sullivan | 82%R chance | R +6.6R +19 to D +5 |
| South CarolinaRegular seatAnnie Andrews / Darline Graham | 86%R chance | R +7.8R +20 to D +4 |
| KansasRegular seatAdam Hamilton / Roger Marshall | 86%R chance | R +7.8R +20 to D +4 |
| MontanaRegular seatSeth Bodnar / Kurt Alme | 87%R chance | R +13.8R +34 to I +6 |
| LouisianaRegular seat"Jamie" Davis / Julia Letlow | 89%R chance | R +8.9R +21 to D +3 |
| IdahoRegular seatTodd Achilles / Jim Risch | 94%R chance | R +18.9R +39 to I +1 |
| FloridaSpecial electionAngie Nixon / Ashley Moody | 95%R chance | R +11.9R +24 to 0 |
| South DakotaRegular seatBrian Bengs / Mike Rounds | 96%R chance | R +21.0R +41 to R +1 |
| MississippiRegular seatScott Colom / Cindy Hyde-Smith | 97%R chance | R +13.3R +25 to R +1 |
| ArkansasRegular seatHallie Shoffner / Tom Cotton | >99%R chance | R +19.6R +32 to R +8 |
| KentuckyRegular seatCharles Booker / Andy Barr | >99%R chance | R +20.2R +32 to R +8 |
| AlabamaRegular seatEverett Wess / Barry Moore | >99%R chance | R +22.3R +34 to R +10 |
| OklahomaRegular seatN'Kiyla Jasmine Thomas / Kevin Hern | >99%R chance | R +30.1R +42 to R +18 |
| TennesseeRegular seatMarquita Bradshaw / Bill Hagerty | >99%R chance | R +30.5R +42 to R +19 |
| WyomingRegular seatJames Byrd / Harriet Hageman | >99%R chance | R +44.8R +59 to R +31 |
| West VirginiaRegular seatRachel Fetty Anderson / Shelley Moore Capito | >99%R chance | R +53.4R +68 to R +39 |
LAST ELECTION
Each seat’s last election, compared with 2026
The Senate is renewed by classes, so the reference is not a single national election. Left: each seat’s last result (2020 for regular seats, 2022 for the two special elections). Right: the expected margin for 2026. Drag the slider to move from one to the other. The four races where an independent faces a Republican have no point of comparison and stay beige.
SEAT'S LAST ELECTIONyear varies by race
FORECAST 2026forecast center
All 2026All history
R +40D/R tieD +40Beige: I/R axis or non-comparable history
Select a race.The comparison does not alter the model.
Historical source: the seat's last archived Senate result, with its year. Differences are computed only when both axes are D−R.
Race by race calculation
How each figure is obtained
Three blocks, weighted by the distance to election day: the polls, the state’s history and the structure. Then the uncertainty, which gives the probability.
Alabama
Everett Wess (D) vs Barry Moore (R)Chance of winning
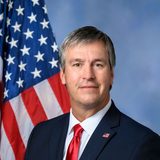 Barry Moore (R)99.9%
Everett Wess (D)0.1%
What drives the forecast
Effect of each element on the expected margin, in points. The total is the forecast margin.
How the forecast has moved
Each candidate's chance of winning, out of 100 (the two add up to 100%). Curve since August 1, recomputed day by day with only the data published at each date.
Two-candidate vote share. Band: 90% range. Curve since August 1, recomputed day by day with only the data published at each date.
Polls used
| Pollster | Field end | Sample | D–R |
|---|---|---|---|
| Cygnal | Oct. 17 | 500 | 35–50 |
| The Alabama Poll | Oct. 16 | 600 | 35–56 |
| RMG Research | Sept. 25 | 800 | 33–54 |
From expected margin to probability
- 90% range
- R +34.2 to R +10.3
- D chance (direct calculation)
- 0.1%
- D chance (200,000 simulations)
- 0.1%
Figures are in points of margin between the two candidates. Polls come from secondary sources (Wikipedia, 270toWin); the link goes to the pollster’s document when it is cited.
Alaska
Mary Peltola (D) vs Dan S. Sullivan (R)Chance of winning
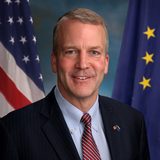 Dan S. Sullivan (R)81.8%
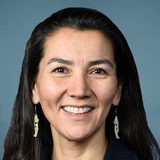 Mary Peltola (D)18.2%
What drives the forecast
Effect of each element on the expected margin, in points. The total is the forecast margin.
How the forecast has moved
Each candidate's chance of winning, out of 100 (the two add up to 100%). Curve since August 1, recomputed day by day with only the data published at each date.
Two-candidate vote share. Band: 90% range. Curve since August 1, recomputed day by day with only the data published at each date.
Polls used
| Pollster | Field end | Sample | D–R |
|---|---|---|---|
| Data for Progress | Oct. 16 | 694 | 47–44 |
| Public Policy Polling | Oct. 15 | 578 | 48–47 |
| InsiderAdvantage | Oct. 10 | 1200 | 50–48 |
| Alaska Survey Research | Oct. 3 | 1512 | 51–49 |
| New York Times/Siena University | Oct. 1 | 504 | 50–43 |
| Quantus Insights | Sept. 30 | 758 | 46–46 |
| Trafalgar Group | Sept. 24 | 1079 | 46–47 |
| co/efficient | Sept. 17 | 799 | 46–48 |
2 older polls.
From expected margin to probability
- 90% range
- R +18.6 to D +5.4
- D chance (direct calculation)
- 18.2%
- D chance (200,000 simulations)
- 18.2%
Highest third candidate: Dan J. Sullivan (R), 3.5% on average. Their chance of winning is bounded by the polls and remains negligible.
Figures are in points of margin between the two candidates. Polls come from secondary sources (Wikipedia, 270toWin); the link goes to the pollster’s document when it is cited.
Arkansas
Hallie Shoffner (D) vs Tom Cotton (R)Chance of winning
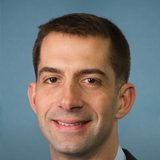 Tom Cotton (R)99.6%
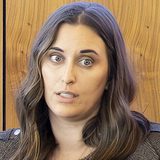 Hallie Shoffner (D)0.4%
What drives the forecast
Effect of each element on the expected margin, in points. The total is the forecast margin.
How the forecast has moved
Each candidate's chance of winning, out of 100 (the two add up to 100%). Curve since August 1, recomputed day by day with only the data published at each date.
Two-candidate vote share. Band: 90% range. Curve since August 1, recomputed day by day with only the data published at each date.
Polls used
| Pollster | Field end | Sample | D–R |
|---|---|---|---|
| Hendrix College | Oct. 13 | 709 | 41–50 |
| GrayHouse | Oct. 4 | 550 | 39–50 |
| J.L. Partners | Aug. 18 | 803 | 35–51 |
From expected margin to probability
- 90% range
- R +31.6 to R +7.6
- D chance (direct calculation)
- 0.4%
- D chance (200,000 simulations)
- 0.4%
Figures are in points of margin between the two candidates. Polls come from secondary sources (Wikipedia, 270toWin); the link goes to the pollster’s document when it is cited.
Colorado
John Hickenlooper (D) vs Mark Baisley (R)Chance of winning
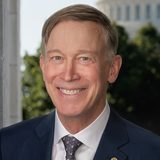 John Hickenlooper (D)100.0%
 Mark Baisley (R)0.0%
What drives the forecast
Effect of each element on the expected margin, in points. The total is the forecast margin.
How the forecast has moved
Each candidate's chance of winning, out of 100 (the two add up to 100%). Curve since August 1, recomputed day by day with only the data published at each date.
Two-candidate vote share. Band: 90% range. Curve since August 1, recomputed day by day with only the data published at each date.
Polls used
No poll published for this race.
From expected margin to probability
- 90% range
- D +17.1 to D +41.0
- D chance (direct calculation)
- 100.0%
- D chance (200,000 simulations)
- 100.0%
Figures are in points of margin between the two candidates. Polls come from secondary sources (Wikipedia, 270toWin); the link goes to the pollster’s document when it is cited.
Delaware
Chris Coons (D) vs Michael "Dr. Mike" Katz (R)Chance of winning
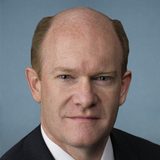 Chris Coons (D)100.0%
Michael "Dr. Mike" Katz (R)0.0%
What drives the forecast
Effect of each element on the expected margin, in points. The total is the forecast margin.
How the forecast has moved
Each candidate's chance of winning, out of 100 (the two add up to 100%). Curve since August 1, recomputed day by day with only the data published at each date.
Two-candidate vote share. Band: 90% range. Curve since August 1, recomputed day by day with only the data published at each date.
Polls used
No poll published for this race.
From expected margin to probability
- 90% range
- D +21.6 to D +50.0
- D chance (direct calculation)
- 100.0%
- D chance (200,000 simulations)
- 100.0%
Figures are in points of margin between the two candidates. Polls come from secondary sources (Wikipedia, 270toWin); the link goes to the pollster’s document when it is cited.
Florida · special election
Angie Nixon (D) vs Ashley Moody (R)Chance of winning
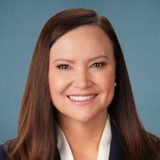 Ashley Moody (R)94.8%
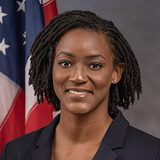 Angie Nixon (D)5.2%
What drives the forecast
Effect of each element on the expected margin, in points. The total is the forecast margin.
How the forecast has moved
Each candidate's chance of winning, out of 100 (the two add up to 100%). Curve since August 1, recomputed day by day with only the data published at each date.
Two-candidate vote share. Band: 90% range. Curve since August 1, recomputed day by day with only the data published at each date.
Polls used
| Pollster | Field end | Sample | D–R |
|---|---|---|---|
| co/efficient | Oct. 20 | 1014 | 40–48 |
| University of North Florida | Oct. 19 | 1471 | 45–49 |
| ActiVote | Oct. 15 | 400 | 47–53 |
| Univision/YouGov | Oct. 15 | 825 | 42–51 |
| MDW Communications | Oct. 10 | 2351 | 42–48 |
| Stetson University | Oct. 9 | 716 | 41–52 |
| St. Pete Polls | Oct. 7 | 836 | 45–47 |
| YouGov | Oct. 5 | 3813 | 44–49 |
5 older polls.
From expected margin to probability
- 90% range
- R +23.8 to D +0.1
- D chance (direct calculation)
- 5.2%
- D chance (200,000 simulations)
- 5.2%
Figures are in points of margin between the two candidates. Polls come from secondary sources (Wikipedia, 270toWin); the link goes to the pollster’s document when it is cited.
Georgia
Jon Ossoff (D) vs Mike Collins (R)Chance of winning
 Jon Ossoff (D)91.5%
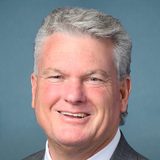 Mike Collins (R)8.5%
What drives the forecast
Effect of each element on the expected margin, in points. The total is the forecast margin.
How the forecast has moved
Each candidate's chance of winning, out of 100 (the two add up to 100%). Curve since August 1, recomputed day by day with only the data published at each date.
Two-candidate vote share. Band: 90% range. Curve since August 1, recomputed day by day with only the data published at each date.
Polls used
| Pollster | Field end | Sample | D–R |
|---|---|---|---|
| ActiVote | Oct. 20 | 400 | 54–46 |
| Quantus Insights | Oct. 17 | 755 | 52–45 |
| University of Georgia School of Public and International Affairs | Oct. 15 | 1000 | 48–40 |
| Trafalgar Group | Oct. 9 | 1101 | 51–43 |
| InsiderAdvantage | Sept. 23 | 1200 | 50–42 |
| Big Data Poll | Sept. 23 | 678 | 52–41 |
| YouGov | Sept. 18 | 3301 | 52–42 |
| Rasmussen Reports | Sept. 14 | 1019 | 51–42 |
From expected margin to probability
- 90% range
- R +2.0 to D +21.9
- D chance (direct calculation)
- 91.5%
- D chance (200,000 simulations)
- 91.5%
Figures are in points of margin between the two candidates. Polls come from secondary sources (Wikipedia, 270toWin); the link goes to the pollster’s document when it is cited.
Idaho
Todd Achilles (I) vs Jim Risch (R)Chance of winning
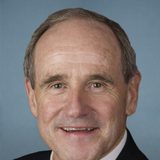 Jim Risch (R)94.2%
 Todd Achilles (I)5.8%
What drives the forecast
Effect of each element on the expected margin, in points. The total is the forecast margin.
How the forecast has moved
Each candidate's chance of winning, out of 100 (the two add up to 100%). Curve since August 1, recomputed day by day with only the data published at each date.
Two-candidate vote share. Band: 90% range. Curve since August 1, recomputed day by day with only the data published at each date.
Polls used
| Pollster | Field end | Sample | I–R |
|---|---|---|---|
| Peak Insights | Sept. 30 | 500 | 24–49 |
| Advanced Targeting Research | Sept. 16 | 700 | 50–39 |
| The Bullfinch Group | Aug. 7 | 608 | 38–33 |
| Change Research | July 30 | 1213 | 21–45 |
From expected margin to probability
- 90% range
- R +38.7 to I +0.9
- I chance (direct calculation)
- 5.8%
- I chance (200,000 simulations)
- 5.8%
Highest third candidate: Other, 11.0% on average. Their chance of winning is bounded by the polls and remains negligible.
Figures are in points of margin between the two candidates. Polls come from secondary sources (Wikipedia, 270toWin); the link goes to the pollster’s document when it is cited.
Illinois
Juliana Stratton (D) vs Don Tracy (R)Chance of winning
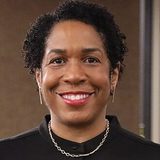 Juliana Stratton (D)96.3%
Don Tracy (R)3.7%
What drives the forecast
Effect of each element on the expected margin, in points. The total is the forecast margin.
How the forecast has moved
Each candidate's chance of winning, out of 100 (the two add up to 100%). Curve since August 1, recomputed day by day with only the data published at each date.
Two-candidate vote share. Band: 90% range. Curve since August 1, recomputed day by day with only the data published at each date.
Polls used
| Pollster | Field end | Sample | D–R |
|---|---|---|---|
| ActiVote | Oct. 20 | 400 | 58–42 |
| Public Policy Polling | Oct. 1 | 569 | 49–36 |
From expected margin to probability
- 90% range
- D +1.3 to D +29.6
- D chance (direct calculation)
- 96.3%
- D chance (200,000 simulations)
- 96.3%
Figures are in points of margin between the two candidates. Polls come from secondary sources (Wikipedia, 270toWin); the link goes to the pollster’s document when it is cited.
Iowa
Josh Turek (D) vs Ashley Hinson (R)Chance of winning
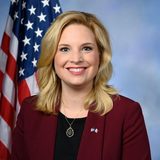 Ashley Hinson (R)73.8%
Josh Turek (D)26.2%
What drives the forecast
Effect of each element on the expected margin, in points. The total is the forecast margin.
How the forecast has moved
Each candidate's chance of winning, out of 100 (the two add up to 100%). Curve since August 1, recomputed day by day with only the data published at each date.
Two-candidate vote share. Band: 90% range. Curve since August 1, recomputed day by day with only the data published at each date.
Polls used
| Pollster | Field end | Sample | D–R |
|---|---|---|---|
| InsiderAdvantage | Oct. 22 | 1200 | 45–47 |
| co/efficient | Oct. 19 | 863 | 45–48 |
| Trafalgar Group | Oct. 15 | 1094 | 44–46 |
| GS Strategy Group/ New River Strategies | Oct. 13 | 602 | 46–44 |
| YouGov | Oct. 12 | 2245 | 47–46 |
| NPA Polling | Oct. 12 | 678 | 44–47 |
| Marist University | Oct. 11 | — | 48–45 |
| Emerson College | Oct. 6 | 650 | 45–47 |
9 older polls.
From expected margin to probability
- 90% range
- R +16.6 to D +7.3
- D chance (direct calculation)
- 26.2%
- D chance (200,000 simulations)
- 26.1%
Figures are in points of margin between the two candidates. Polls come from secondary sources (Wikipedia, 270toWin); the link goes to the pollster’s document when it is cited.
Kansas
Adam Hamilton (D) vs Roger Marshall (R)Chance of winning
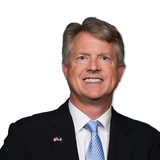 Roger Marshall (R)86.0%
 Adam Hamilton (D)14.0%
What drives the forecast
Effect of each element on the expected margin, in points. The total is the forecast margin.
How the forecast has moved
Each candidate's chance of winning, out of 100 (the two add up to 100%). Curve since August 1, recomputed day by day with only the data published at each date.
Two-candidate vote share. Band: 90% range. Curve since August 1, recomputed day by day with only the data published at each date.
Polls used
| Pollster | Field end | Sample | D–R |
|---|---|---|---|
| InsiderAdvantage | Oct. 14 | 1200 | 47–48 |
| GBAO | Oct. 4 | 600 | 46–41 |
| YouGov | Oct. 4 | 2255 | 48–45 |
| Trafalgar Group | Oct. 1 | 1095 | 44–44 |
| New York Times/Siena University | Sept. 30 | 605 | 45–45 |
| Global Strategy Group | Sept. 16 | 800 | 49–47 |
| Emerson College | Sept. 16 | 750 | 45–43 |
| co/efficient | Sept. 10 | 915 | 44–49 |
1 older poll.
From expected margin to probability
- 90% range
- R +19.8 to D +4.1
- D chance (direct calculation)
- 14.0%
- D chance (200,000 simulations)
- 14.1%
Figures are in points of margin between the two candidates. Polls come from secondary sources (Wikipedia, 270toWin); the link goes to the pollster’s document when it is cited.
Kentucky
Charles Booker (D) vs Andy Barr (R)Chance of winning
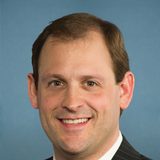 Andy Barr (R)99.7%
 Charles Booker (D)0.3%
What drives the forecast
Effect of each element on the expected margin, in points. The total is the forecast margin.
How the forecast has moved
Each candidate's chance of winning, out of 100 (the two add up to 100%). Curve since August 1, recomputed day by day with only the data published at each date.
Two-candidate vote share. Band: 90% range. Curve since August 1, recomputed day by day with only the data published at each date.
Polls used
| Pollster | Field end | Sample | D–R |
|---|---|---|---|
| Global Strategy Group | Aug. 27 | 600 | 40–49 |
From expected margin to probability
- 90% range
- R +32.2 to R +8.2
- D chance (direct calculation)
- 0.3%
- D chance (200,000 simulations)
- 0.3%
Figures are in points of margin between the two candidates. Polls come from secondary sources (Wikipedia, 270toWin); the link goes to the pollster’s document when it is cited.
Louisiana
"Jamie" Davis (D) vs Julia Letlow (R)Chance of winning
 Julia Letlow (R)88.8%
"Jamie" Davis (D)11.2%
What drives the forecast
Effect of each element on the expected margin, in points. The total is the forecast margin.
How the forecast has moved
Each candidate's chance of winning, out of 100 (the two add up to 100%). Curve since August 1, recomputed day by day with only the data published at each date.
Two-candidate vote share. Band: 90% range. Curve since August 1, recomputed day by day with only the data published at each date.
Polls used
| Pollster | Field end | Sample | D–R |
|---|---|---|---|
| Hart Research Associates | Sept. 19 | 500 | 44–48 |
From expected margin to probability
- 90% range
- R +20.8 to D +3.1
- D chance (direct calculation)
- 11.2%
- D chance (200,000 simulations)
- 11.1%
Figures are in points of margin between the two candidates. Polls come from secondary sources (Wikipedia, 270toWin); the link goes to the pollster’s document when it is cited.
Maine
Troy D. Jackson (D) vs Susan M. Collins (R)Chance of winning
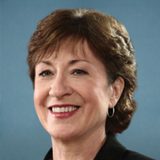 Susan M. Collins (R)56.9%
 Troy D. Jackson (D)43.1%
What drives the forecast
Effect of each element on the expected margin, in points. The total is the forecast margin.
How the forecast has moved
Each candidate's chance of winning, out of 100 (the two add up to 100%). Curve since August 1, recomputed day by day with only the data published at each date.
Two-candidate vote share. Band: 90% range. Curve since August 1, recomputed day by day with only the data published at each date.
Polls used
| Pollster | Field end | Sample | D–R |
|---|---|---|---|
| Beacon Research/ Shaw & Co. Research | Oct. 20 | 1514 | 49–49 |
| InsiderAdvantage | Oct. 14 | 1200 | 49–47 |
| Suffolk University | Oct. 11 | 500 | 49–47 |
| Rasmussen Reports | Oct. 8 | 804 | 49–47 |
| The Washington Post/SSPG | Oct. 5 | 800 | 50–46 |
| Marist University | Oct. 4 | 1505 | 51–47 |
| CBS News/YouGov | Oct. 1 | 1136 | 50–50 |
| Trafalgar Group | Oct. 1 | 1091 | 46–46 |
11 older polls.
From expected margin to probability
- 90% range
- R +13.2 to D +10.7
- D chance (direct calculation)
- 43.1%
- D chance (200,000 simulations)
- 43.0%
Highest third candidate: Other, 2.1% on average. Their chance of winning is bounded by the polls and remains negligible.
Figures are in points of margin between the two candidates. Polls come from secondary sources (Wikipedia, 270toWin); the link goes to the pollster’s document when it is cited.
Massachusetts
Edward J. Markey (D) vs John Deaton (R)Chance of winning
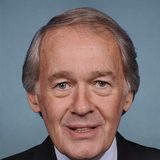 Edward J. Markey (D)100.0%
 John Deaton (R)0.0%
What drives the forecast
Effect of each element on the expected margin, in points. The total is the forecast margin.
How the forecast has moved
Each candidate's chance of winning, out of 100 (the two add up to 100%). Curve since August 1, recomputed day by day with only the data published at each date.
Two-candidate vote share. Band: 90% range. Curve since August 1, recomputed day by day with only the data published at each date.
Polls used
| Pollster | Field end | Sample | D–R |
|---|---|---|---|
| Suffolk University | Oct. 18 | 500 | 60–32 |
| UMass Amherst/YouGov | Oct. 12 | 800 | 54–28 |
| MassINC Polling Group | Sept. 22 | 800 | 52–26 |
| University of New Hampshire | Sept. 21 | 564 | 53–30 |
From expected margin to probability
- 90% range
- D +19.9 to D +43.9
- D chance (direct calculation)
- 100.0%
- D chance (200,000 simulations)
- 100.0%
Figures are in points of margin between the two candidates. Polls come from secondary sources (Wikipedia, 270toWin); the link goes to the pollster’s document when it is cited.
Michigan
Abdul El-Sayed (D) vs Mike Rogers (R)Chance of winning
 Abdul El-Sayed (D)59.7%
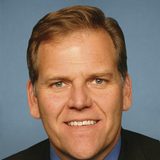 Mike Rogers (R)40.3%
What drives the forecast
Effect of each element on the expected margin, in points. The total is the forecast margin.
How the forecast has moved
Each candidate's chance of winning, out of 100 (the two add up to 100%). Curve since August 1, recomputed day by day with only the data published at each date.
Two-candidate vote share. Band: 90% range. Curve since August 1, recomputed day by day with only the data published at each date.
Polls used
| Pollster | Field end | Sample | D–R |
|---|---|---|---|
| InsiderAdvantage | Oct. 22 | 1200 | 47–46 |
| Marist University | Oct. 18 | — | 50–48 |
| Rasmussen Reports | Oct. 14 | 798 | 46–44 |
| The Tyson Group | Oct. 8 | 600 | 44–46 |
| Quantus Insights | Oct. 6 | 762 | 48–47 |
| YouGov | Oct. 4 | 3949 | 49–48 |
| Mitchell Research & Communications | Oct. 1 | 682 | 46–41 |
| Z to A Research | Oct. 1 | 483 | 49–42 |
20 older polls.
From expected margin to probability
- 90% range
- R +10.2 to D +13.8
- D chance (direct calculation)
- 59.7%
- D chance (200,000 simulations)
- 59.9%
Figures are in points of margin between the two candidates. Polls come from secondary sources (Wikipedia, 270toWin); the link goes to the pollster’s document when it is cited.
Minnesota
Peggy Flanagan (D) vs Michele Tafoya (R)Chance of winning
 Peggy Flanagan (D)73.5%
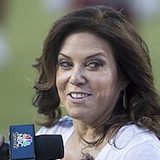 Michele Tafoya (R)26.5%
What drives the forecast
Effect of each element on the expected margin, in points. The total is the forecast margin.
How the forecast has moved
Each candidate's chance of winning, out of 100 (the two add up to 100%). Curve since August 1, recomputed day by day with only the data published at each date.
Two-candidate vote share. Band: 90% range. Curve since August 1, recomputed day by day with only the data published at each date.
Polls used
| Pollster | Field end | Sample | D–R |
|---|---|---|---|
| Rasmussen Reports | Oct. 21 | 1182 | 48–45 |
| Trafalgar Group | Oct. 15 | 1079 | 48–45 |
| KSTP/SurveyUSA | Oct. 12 | 718 | 45–42 |
| Mason-Dixon Polling & Strategy | Oct. 7 | 800 | 47–43 |
| Morning Consult | Oct. 7 | 1000 | 45–41 |
| GQR | Oct. 4 | 800 | 50–42 |
| Big Data Poll | Sept. 30 | 622 | 40–38 |
| InsiderAdvantage | Sept. 29 | 1200 | 46–45 |
5 older polls.
From expected margin to probability
- 90% range
- R +7.4 to D +16.5
- D chance (direct calculation)
- 73.5%
- D chance (200,000 simulations)
- 73.4%
Figures are in points of margin between the two candidates. Polls come from secondary sources (Wikipedia, 270toWin); the link goes to the pollster’s document when it is cited.
Mississippi
Scott Colom (D) vs Cindy Hyde-Smith (R)Chance of winning
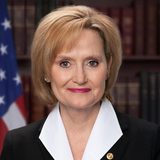 Cindy Hyde-Smith (R)96.6%
Scott Colom (D)3.4%
What drives the forecast
Effect of each element on the expected margin, in points. The total is the forecast margin.
How the forecast has moved
Each candidate's chance of winning, out of 100 (the two add up to 100%). Curve since August 1, recomputed day by day with only the data published at each date.
Two-candidate vote share. Band: 90% range. Curve since August 1, recomputed day by day with only the data published at each date.
Polls used
| Pollster | Field end | Sample | D–R |
|---|---|---|---|
| Change Research | Oct. 22 | 842 | 40–43 |
| Data for Progress | Aug. 15 | 1018 | 38–44 |
From expected margin to probability
- 90% range
- R +25.2 to R +1.3
- D chance (direct calculation)
- 3.4%
- D chance (200,000 simulations)
- 3.5%
Figures are in points of margin between the two candidates. Polls come from secondary sources (Wikipedia, 270toWin); the link goes to the pollster’s document when it is cited.
Montana
Seth Bodnar (I) vs Kurt Alme (R)Chance of winning
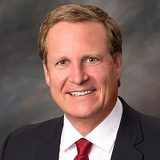 Kurt Alme (R)87.3%
 Seth Bodnar (I)12.7%
What drives the forecast
Effect of each element on the expected margin, in points. The total is the forecast margin.
How the forecast has moved
Each candidate's chance of winning, out of 100 (the two add up to 100%). Curve since August 1, recomputed day by day with only the data published at each date.
Two-candidate vote share. Band: 90% range. Curve since August 1, recomputed day by day with only the data published at each date.
Polls used
| Pollster | Field end | Sample | I–R |
|---|---|---|---|
| Quantus Insights | Oct. 18 | 667 | 28–44 |
| Peak Insights | Oct. 12 | 500 | 29–44 |
| Concord Public Opinion Partners | Oct. 8 | 405 | 37–35 |
| American Pulse Research | Sept. 24 | 604 | 26–45 |
| Aspect Strategic | Sept. 15 | 715 | 32–44 |
| Rutgers University Eagleton Institute of Politics | Sept. 7 | 845 | 30–38 |
| Hart Research | Aug. 4 | 800 | 30–45 |
| Tavern Research | July 27 | 517 | 25–49 |
1 older poll.
From expected margin to probability
- 90% range
- R +33.6 to I +6.1
- I chance (direct calculation)
- 12.7%
- I chance (200,000 simulations)
- 12.6%
Highest third candidate: Alani Bankhead (D), 15.8% on average. Their chance of winning is bounded by the polls and remains negligible.
Figures are in points of margin between the two candidates. Polls come from secondary sources (Wikipedia, 270toWin); the link goes to the pollster’s document when it is cited.
Nebraska
Dan Osborn (I) vs Pete Ricketts (R)Chance of winning
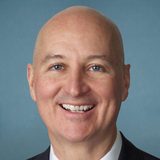 Pete Ricketts (R)75.5%
 Dan Osborn (I)24.5%
What drives the forecast
Effect of each element on the expected margin, in points. The total is the forecast margin.
How the forecast has moved
Each candidate's chance of winning, out of 100 (the two add up to 100%). Curve since August 1, recomputed day by day with only the data published at each date.
Two-candidate vote share. Band: 90% range. Curve since August 1, recomputed day by day with only the data published at each date.
Polls used
| Pollster | Field end | Sample | I–R |
|---|---|---|---|
| GBAO | Oct. 22 | 800 | 46–45 |
| Impact Research | Oct. 20 | 600 | 47–49 |
| National Public Affairs | Oct. 18 | 598 | 43–46 |
| YouGov | Oct. 3 | 1809 | 48–47 |
| co/efficient | Sept. 30 | 1113 | 40–45 |
| SurveyUSA | Sept. 13 | 503 | 46–42 |
From expected margin to probability
- 90% range
- R +28.2 to I +11.5
- I chance (direct calculation)
- 24.5%
- I chance (200,000 simulations)
- 24.3%
Highest third candidate: Other, 3.7% on average. Their chance of winning is bounded by the polls and remains negligible.
Figures are in points of margin between the two candidates. Polls come from secondary sources (Wikipedia, 270toWin); the link goes to the pollster’s document when it is cited.
New Hampshire
Chris Pappas (D) vs John E. Sununu (R)Chance of winning
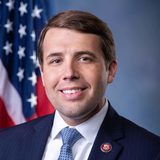 Chris Pappas (D)76.8%
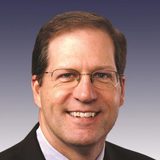 John E. Sununu (R)23.2%
What drives the forecast
Effect of each element on the expected margin, in points. The total is the forecast margin.
How the forecast has moved
Each candidate's chance of winning, out of 100 (the two add up to 100%). Curve since August 1, recomputed day by day with only the data published at each date.
Two-candidate vote share. Band: 90% range. Curve since August 1, recomputed day by day with only the data published at each date.
Polls used
| Pollster | Field end | Sample | D–R |
|---|---|---|---|
| Saint Anselm College | Oct. 20 | 1672 | 50–43 |
| National Public Affairs | Oct. 12 | 600 | 50–45 |
| YouGov | Oct. 5 | 1520 | 51–43 |
| Trafalgar Group | Sept. 27 | 1082 | 47–41 |
| New York Times/Siena University | Sept. 22 | 613 | 50–45 |
| University of New Hampshire | Sept. 21 | 1418 | 50–42 |
| InsiderAdvantage | Sept. 17 | 1200 | 48–40 |
| co/efficient | Sept. 11 | 958 | 46–46 |
2 older polls.
From expected margin to probability
- 90% range
- R +6.6 to D +17.3
- D chance (direct calculation)
- 76.8%
- D chance (200,000 simulations)
- 76.8%
Figures are in points of margin between the two candidates. Polls come from secondary sources (Wikipedia, 270toWin); the link goes to the pollster’s document when it is cited.
New Jersey
Cory Booker (D) vs Justin Murphy (R)Chance of winning
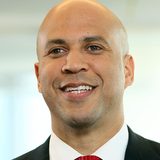 Cory Booker (D)100.0%
Justin Murphy (R)0.0%
What drives the forecast
Effect of each element on the expected margin, in points. The total is the forecast margin.
How the forecast has moved
Each candidate's chance of winning, out of 100 (the two add up to 100%). Curve since August 1, recomputed day by day with only the data published at each date.
Two-candidate vote share. Band: 90% range. Curve since August 1, recomputed day by day with only the data published at each date.
Polls used
No poll published for this race.
From expected margin to probability
- 90% range
- D +18.3 to D +46.6
- D chance (direct calculation)
- 100.0%
- D chance (200,000 simulations)
- 100.0%
Figures are in points of margin between the two candidates. Polls come from secondary sources (Wikipedia, 270toWin); the link goes to the pollster’s document when it is cited.
New Mexico
Ben R. Luján (D) vs Larry E. Marker (write-in primaire R) (R)Chance of winning
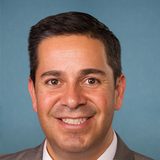 Ben R. Luján (D)99.6%
Larry E. Marker (write-in primaire R) (R)0.4%
What drives the forecast
Effect of each element on the expected margin, in points. The total is the forecast margin.
How the forecast has moved
Each candidate's chance of winning, out of 100 (the two add up to 100%). Curve since August 1, recomputed day by day with only the data published at each date.
Two-candidate vote share. Band: 90% range. Curve since August 1, recomputed day by day with only the data published at each date.
Polls used
| Pollster | Field end | Sample | D–R |
|---|---|---|---|
| Research & Polling Inc. | Oct. 9 | 1125 | 53–37 |
| SurveyUSA | Sept. 30 | 567 | 54–36 |
From expected margin to probability
- 90% range
- D +7.3 to D +31.2
- D chance (direct calculation)
- 99.6%
- D chance (200,000 simulations)
- 99.6%
Figures are in points of margin between the two candidates. Polls come from secondary sources (Wikipedia, 270toWin); the link goes to the pollster’s document when it is cited.
North Carolina
Roy Cooper (D) vs Michael Whatley (R)Chance of winning
 Roy Cooper (D)85.3%
 Michael Whatley (R)14.7%
What drives the forecast
Effect of each element on the expected margin, in points. The total is the forecast margin.
How the forecast has moved
Each candidate's chance of winning, out of 100 (the two add up to 100%). Curve since August 1, recomputed day by day with only the data published at each date.
Two-candidate vote share. Band: 90% range. Curve since August 1, recomputed day by day with only the data published at each date.
Polls used
| Pollster | Field end | Sample | D–R |
|---|---|---|---|
| Harper Polling | Oct. 22 | 600 | 49–39 |
| ActiVote | Oct. 20 | 400 | 57–43 |
| SurveyUSA | Oct. 11 | 643 | 54–40 |
| Trafalgar Group | Oct. 10 | 1091 | 49–41 |
| Elon University/YouGov | Oct. 8 | 561 | 52–39 |
| Change Research | Oct. 7 | 829 | 50–40 |
| East Carolina University | Oct. 3 | 810 | 50–43 |
| Catawba College | Sept. 30 | 885 | 48–37 |
11 older polls.
From expected margin to probability
- 90% range
- R +4.3 to D +19.6
- D chance (direct calculation)
- 85.3%
- D chance (200,000 simulations)
- 85.2%
Figures are in points of margin between the two candidates. Polls come from secondary sources (Wikipedia, 270toWin); the link goes to the pollster’s document when it is cited.
Ohio · special election
Sherrod Brown (D) vs Jon Husted (R)Chance of winning
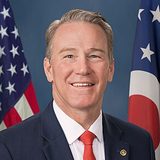 Jon Husted (R)75.8%
 Sherrod Brown (D)24.2%
What drives the forecast
Effect of each element on the expected margin, in points. The total is the forecast margin.
How the forecast has moved
Each candidate's chance of winning, out of 100 (the two add up to 100%). Curve since August 1, recomputed day by day with only the data published at each date.
Two-candidate vote share. Band: 90% range. Curve since August 1, recomputed day by day with only the data published at each date.
Polls used
| Pollster | Field end | Sample | D–R |
|---|---|---|---|
| InsiderAdvantage | Oct. 22 | 1200 | 47–44 |
| Verasight/VoteHub | Oct. 20 | 531 | 45–41 |
| Beacon Research/ Shaw & Co. Research | Oct. 19 | 1592 | 52–47 |
| ActiVote | Oct. 18 | 400 | 50–50 |
| Marist University | Oct. 18 | — | 48–44 |
| Rasmussen Reports | Oct. 14 | 901 | 47–49 |
| GS Strategy Group/New River Strategies | Oct. 13 | 959 | 49–43 |
| Bowling Green State University/YouGov | Oct. 9 | 1000 | 48–42 |
10 older polls.
From expected margin to probability
- 90% range
- R +17.1 to D +6.9
- D chance (direct calculation)
- 24.2%
- D chance (200,000 simulations)
- 24.3%
Figures are in points of margin between the two candidates. Polls come from secondary sources (Wikipedia, 270toWin); the link goes to the pollster’s document when it is cited.
Oklahoma
N'Kiyla Jasmine Thomas (D) vs Kevin Hern (R)Chance of winning
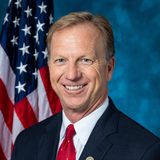 Kevin Hern (R)100.0%
N'Kiyla Jasmine Thomas (D)0.0%
What drives the forecast
Effect of each element on the expected margin, in points. The total is the forecast margin.
How the forecast has moved
Each candidate's chance of winning, out of 100 (the two add up to 100%). Curve since August 1, recomputed day by day with only the data published at each date.
Two-candidate vote share. Band: 90% range. Curve since August 1, recomputed day by day with only the data published at each date.
Polls used
| Pollster | Field end | Sample | D–R |
|---|---|---|---|
| CHS & Associates | Aug. 6 | 500 | 25–49 |
From expected margin to probability
- 90% range
- R +42.1 to R +18.1
- D chance (direct calculation)
- 0.0%
- D chance (200,000 simulations)
- 0.0%
Figures are in points of margin between the two candidates. Polls come from secondary sources (Wikipedia, 270toWin); the link goes to the pollster’s document when it is cited.
Oregon
Jeff Merkley (D) vs David Brock Smith (R)Chance of winning
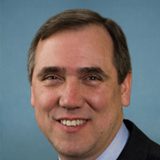 Jeff Merkley (D)100.0%
 David Brock Smith (R)0.0%
What drives the forecast
Effect of each element on the expected margin, in points. The total is the forecast margin.
How the forecast has moved
Each candidate's chance of winning, out of 100 (the two add up to 100%). Curve since August 1, recomputed day by day with only the data published at each date.
Two-candidate vote share. Band: 90% range. Curve since August 1, recomputed day by day with only the data published at each date.
Polls used
No poll published for this race.
From expected margin to probability
- 90% range
- D +18.0 to D +46.4
- D chance (direct calculation)
- 100.0%
- D chance (200,000 simulations)
- 100.0%
Figures are in points of margin between the two candidates. Polls come from secondary sources (Wikipedia, 270toWin); the link goes to the pollster’s document when it is cited.
Rhode Island
John F. Reed (D) vs Raymond T. McKay (R)Chance of winning
 John F. Reed (D)100.0%
Raymond T. McKay (R)0.0%
What drives the forecast
Effect of each element on the expected margin, in points. The total is the forecast margin.
How the forecast has moved
Each candidate's chance of winning, out of 100 (the two add up to 100%). Curve since August 1, recomputed day by day with only the data published at each date.
Two-candidate vote share. Band: 90% range. Curve since August 1, recomputed day by day with only the data published at each date.
Polls used
| Pollster | Field end | Sample | D–R |
|---|---|---|---|
| Emerson College/WPRI-TV | Oct. 11 | 800 | 59–25 |
| Embold Research | Oct. 8 | 815 | 55–32 |
| University of New Hampshire | Sept. 21 | 595 | 53–33 |
From expected margin to probability
- 90% range
- D +16.0 to D +40.0
- D chance (direct calculation)
- 100.0%
- D chance (200,000 simulations)
- 100.0%
Figures are in points of margin between the two candidates. Polls come from secondary sources (Wikipedia, 270toWin); the link goes to the pollster’s document when it is cited.
South Carolina
Annie Andrews (D) vs Darline Graham (R)Chance of winning
 Darline Graham (R)85.8%
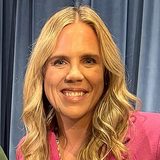 Annie Andrews (D)14.2%
What drives the forecast
Effect of each element on the expected margin, in points. The total is the forecast margin.
How the forecast has moved
Each candidate's chance of winning, out of 100 (the two add up to 100%). Curve since August 1, recomputed day by day with only the data published at each date.
Two-candidate vote share. Band: 90% range. Curve since August 1, recomputed day by day with only the data published at each date.
Polls used
| Pollster | Field end | Sample | D–R |
|---|---|---|---|
| Impact Research | Oct. 21 | 800 | 45–44 |
| Trafalgar Group | Oct. 18 | 1095 | 46–49 |
| Rasmussen Reports | Oct. 8 | 837 | 45–49 |
| InsiderAdvantage | Sept. 29 | 1200 | 45–46 |
| Abacus Data | Aug. 28 | 306 | 42–55 |
From expected margin to probability
- 90% range
- R +19.8 to D +4.2
- D chance (direct calculation)
- 14.2%
- D chance (200,000 simulations)
- 14.2%
Figures are in points of margin between the two candidates. Polls come from secondary sources (Wikipedia, 270toWin); the link goes to the pollster’s document when it is cited.
South Dakota
Brian Bengs (I) vs Mike Rounds (R)Chance of winning
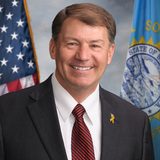 Mike Rounds (R)95.9%
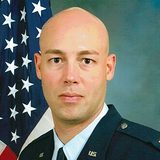 Brian Bengs (I)4.1%
What drives the forecast
Effect of each element on the expected margin, in points. The total is the forecast margin.
How the forecast has moved
Each candidate's chance of winning, out of 100 (the two add up to 100%). Curve since August 1, recomputed day by day with only the data published at each date.
Two-candidate vote share. Band: 90% range. Curve since August 1, recomputed day by day with only the data published at each date.
Polls used
| Pollster | Field end | Sample | I–R |
|---|---|---|---|
| Emerson College | Oct. 20 | 803 | 42–50 |
| Quantus Insights | Oct. 19 | 633 | 37–57 |
| Public Opinon Strategies | Oct. 16 | 500 | 37–54 |
| Mason-Dixon Polling & Strategy | Oct. 14 | 500 | 37–56 |
| Concord Public Opinion Partners | Oct. 8 | 400 | 43–42 |
| Zenith Research | Sept. 27 | 500 | 38–44 |
| Public Policy Polling | Sept. 9 | 629 | 42–45 |
| Lake Research Partners | Aug. 30 | 500 | 51–44 |
1 older poll.
From expected margin to probability
- 90% range
- R +40.8 to R +1.1
- I chance (direct calculation)
- 4.1%
- I chance (200,000 simulations)
- 4.1%
Highest third candidate: Other, 5.3% on average. Their chance of winning is bounded by the polls and remains negligible.
Figures are in points of margin between the two candidates. Polls come from secondary sources (Wikipedia, 270toWin); the link goes to the pollster’s document when it is cited.
Tennessee
Marquita Bradshaw (D) vs Bill Hagerty (R)Chance of winning
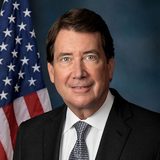 Bill Hagerty (R)100.0%
 Marquita Bradshaw (D)0.0%
What drives the forecast
Effect of each element on the expected margin, in points. The total is the forecast margin.
How the forecast has moved
Each candidate's chance of winning, out of 100 (the two add up to 100%). Curve since August 1, recomputed day by day with only the data published at each date.
Two-candidate vote share. Band: 90% range. Curve since August 1, recomputed day by day with only the data published at each date.
Polls used
| Pollster | Field end | Sample | D–R |
|---|---|---|---|
| Beacon Poll | Sept. 2 | 1200 | 31–51 |
| Targoz Market Research | Aug. 26 | 607 | 33–58 |
From expected margin to probability
- 90% range
- R +42.5 to R +18.5
- D chance (direct calculation)
- 0.0%
- D chance (200,000 simulations)
- 0.0%
Figures are in points of margin between the two candidates. Polls come from secondary sources (Wikipedia, 270toWin); the link goes to the pollster’s document when it is cited.
Texas
James Talarico (D) vs Ken Paxton (R)Chance of winning
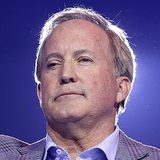 Ken Paxton (R)54.9%
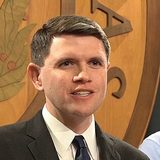 James Talarico (D)45.1%
What drives the forecast
Effect of each element on the expected margin, in points. The total is the forecast margin.
How the forecast has moved
Each candidate's chance of winning, out of 100 (the two add up to 100%). Curve since August 1, recomputed day by day with only the data published at each date.
Two-candidate vote share. Band: 90% range. Curve since August 1, recomputed day by day with only the data published at each date.
Polls used
| Pollster | Field end | Sample | D–R |
|---|---|---|---|
| ActiVote | Oct. 21 | 400 | 51–49 |
| Rasmussen Reports | Oct. 21 | 965 | 45–45 |
| Verasight/VoteHub | Oct. 20 | 509 | 46–41 |
| Beacon Research/ Shaw & Co. Research | Oct. 19 | 1398 | 49–49 |
| Emerson College | Oct. 19 | 1000 | 48–46 |
| Pollfinity Research | Oct. 18 | 278 | 48–43 |
| Texas Public Opinion Research | Oct. 18 | 969 | 51–47 |
| CBS News/YouGov | Oct. 16 | 1492 | 51–49 |
22 older polls.
From expected margin to probability
- 90% range
- R +12.9 to D +11.1
- D chance (direct calculation)
- 45.1%
- D chance (200,000 simulations)
- 45.1%
Figures are in points of margin between the two candidates. Polls come from secondary sources (Wikipedia, 270toWin); the link goes to the pollster’s document when it is cited.
Virginia
Mark R. Warner (D) vs Bert Mizusawa (R)Chance of winning
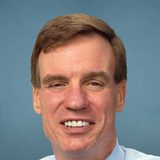 Mark R. Warner (D)100.0%
 Bert Mizusawa (R)0.0%
What drives the forecast
Effect of each element on the expected margin, in points. The total is the forecast margin.
How the forecast has moved
Each candidate's chance of winning, out of 100 (the two add up to 100%). Curve since August 1, recomputed day by day with only the data published at each date.
Two-candidate vote share. Band: 90% range. Curve since August 1, recomputed day by day with only the data published at each date.
Polls used
No poll published for this race.
From expected margin to probability
- 90% range
- D +12.2 to D +36.1
- D chance (direct calculation)
- 100.0%
- D chance (200,000 simulations)
- 100.0%
Figures are in points of margin between the two candidates. Polls come from secondary sources (Wikipedia, 270toWin); the link goes to the pollster’s document when it is cited.
West Virginia
Rachel Fetty Anderson (D) vs Shelley Moore Capito (R)Chance of winning
 Shelley Moore Capito (R)100.0%
Rachel Fetty Anderson (D)0.0%
What drives the forecast
Effect of each element on the expected margin, in points. The total is the forecast margin.
How the forecast has moved
Each candidate's chance of winning, out of 100 (the two add up to 100%). Curve since August 1, recomputed day by day with only the data published at each date.
Two-candidate vote share. Band: 90% range. Curve since August 1, recomputed day by day with only the data published at each date.
Polls used
No poll published for this race.
From expected margin to probability
- 90% range
- R +67.5 to R +39.2
- D chance (direct calculation)
- 0.0%
- D chance (200,000 simulations)
- 0.0%
Figures are in points of margin between the two candidates. Polls come from secondary sources (Wikipedia, 270toWin); the link goes to the pollster’s document when it is cited.
Wyoming
James Byrd (D) vs Harriet Hageman (R)Chance of winning
 Harriet Hageman (R)100.0%
James Byrd (D)0.0%
What drives the forecast
Effect of each element on the expected margin, in points. The total is the forecast margin.
How the forecast has moved
Each candidate's chance of winning, out of 100 (the two add up to 100%). Curve since August 1, recomputed day by day with only the data published at each date.
Two-candidate vote share. Band: 90% range. Curve since August 1, recomputed day by day with only the data published at each date.
Polls used
No poll published for this race.
From expected margin to probability
- 90% range
- R +59.0 to R +30.6
- D chance (direct calculation)
- 0.0%
- D chance (200,000 simulations)
- 0.0%
Figures are in points of margin between the two candidates. Polls come from secondary sources (Wikipedia, 270toWin); the link goes to the pollster’s document when it is cited.
Method
How the forecast is built
The same method as Le Millénaire’s other forecasts (France, Germany, Brazil, Israel), adapted to the US Senate.
History starts from the state’s 2024 presidential margin and adds today’s generic ballot. It also gives an edge to a sitting senator on the ballot, appointed ones included, and a smaller edge to a former senator or governor of the state. Both effects were learned on 148 races from 2014 to 2022. Structure adds the seat’s last election and the candidates’ profiles.
The weight of the polls rises as the vote approaches. Three weeks out, they count for more than history and structure combined.
200,000 draws. A shared national shock links the Democrat versus Republican races; each race also keeps its own uncertainty.
Poll bias correction. In the 2006 to 2022 midterms, polls overstated Democrats every time. The average gap depends on the distance to election day: 2.95 points a month out, 2.26 on the eve. The model takes off every poll (generic ballot, race and district polls) the gap matching today's date: 2.49 points today.
What the method gave on past elections
Out-of-sample test on the 132 Senate races from 2014 to 2022: for each year, the model learns only from the others. Error in points of margin between the two candidates.
| Method | Mean error | Root mean square error | Winner called |
|---|---|---|---|
| Three blocks, Le Millénaire method (used) | 4.58 | 5.92 | 90.9% |
| Polls only, simple average | 4.94 | 6.33 | 90.9% |
| History only | 6.60 | 9.99 | 83.3% |
| Structure only | 7.52 | 10.85 | 82.6% |
Limits
- Each race is simulated as a two-way contest. A third candidate is bounded by the polls, without simulating their score.
- Polls come from secondary sources; checking against the pollster’s document is manual.
- Past errors do not guarantee accuracy in 2026. The national control probability has no historical test of its own.
Sources
Where the data come from
Wikipedia and 270toWin, collected daily, with the link to the pollster’s document when it is cited. Pollster reliability ratings: FiveThirtyEight public archive, 2010-2022 elections. Polls taken into account up to October 24, 2026.
2024 presidential vote by state: certified results published by the Federal Election Commission (FEC). Generic ballot: average of national polls (Wikipedia, PollsMax).
Officially registered candidates, checked race by race; last certified Senate results for each seat.
Party symbols. The donkey and the elephant are the symbols of the Democratic and Republican parties (Wikimedia Commons files). Used for identification; no affiliation.
Pollsters used (109 pollsters, number of polls)
- InsiderAdvantage13
- Quantus Insights12
- Trafalgar Group12
- Rasmussen Reports11
- YouGov11
- co/efficient10
- New York Times/Siena University8
- ActiVote6
- Beacon Research/ Shaw & Co. Research6
- Big Data Poll6
- Abacus Data5
- Emerson College5
- Fabrizio Ward/ Impact Research5
- Marist University5
- Suffolk University5
- Change Research4
- Public Policy Polling4
- SSRS4
- University of New Hampshire4
- GBAO3
- Global Strategy Group3
- Impact Research3
- SurveyUSA3
- CBS News/YouGov2
- Concord Public Opinion Partners2
- Cygnal2
- Data for Progress2
- GQR2
- GS Strategy Group/ New River Strategies2
- Guidant Polling & Strategy2
- Hart Research2
- Mason-Dixon2
- Mason-Dixon Polling & Strategy2
- National Public Affairs2
- Peak Insights2
- Targoz Market Research2
- The Washington Post/SSPG2
- TIPP Insights2
- Univision/YouGov2
- Verasight/VoteHub2
- Advanced Targeting Research1
- Alaska Survey Research1
- American Pulse Research1
- Aspect Strategic1
- Beacon Poll1
- Bowling Green State University/YouGov1
- Catawba College1
- Catawba College/YouGov1
- CHS & Associates1
- Cygnal/Beacon Research1
- Deep Root Analytics1
- East Carolina University1
- Elon University/YouGov1
- Embold Research1
- Emerson College/WPRI-TV1
- EPIC-MRA1
- Fabrizio, Lee, & Associates1
- Glengariff Group1
- GrayHouse1
- GS Strategy Group/New River Strategies1
- Harper Polling1
- Hart Research Associates1
- Hendrix College1
- High Point University1
- High Point University/YouGov1
- J.L. Partners1
- KSTP/SurveyUSA1
- KTSP/SurveyUSA1
- Lake Research Partners1
- Maine People's Resource Center1
- MassINC Polling Group1
- MDW Communications1
- Michigan State University/YouGov1
- Mitchell Research & Communications1
- Morning Consult1
- NPA Polling1
- Opinion Diagnostics1
- Overton Insights1
- Pollfinity Research1
- Public Opinon Strategies1
- Pulse Decision Science1
- ReconMR/Siena University1
- Research & Polling Inc.1
- RMG Research1
- Rutgers University Eagleton Institute of Politics1
- Saint Anselm College1
- St. Pete Polls1
- Stetson University1
- Stratus Intelligence1
- Susquehanna Polling & Research1
- Tavern Research1
- Texas A&M University/ReconMR/Siena University1
- Texas Public Opinion Research1
- Texas Southern University1
- The Alabama Poll1
- The Bullfinch Group1
- The Tyson Group1
- Torchlight Strategies1
- Tulchin Research1
- UMass Amherst/YouGov1
- UMass Lowell/YouGov1
- University of Georgia School of Public and International Affairs1
- University of Houston1
- University of Massachusetts/YouGov1
- University of North Florida1
- University of Texas/Texas Politics Project1
- YouGov Blue1
- Z to A Research1
- Zenith Research1
Links to the 229 poll documents
http://texaspolitics.utexas.edu/blog/latest-ut-texas-politics-poll-finds-historic-levels-of-competition-in-texas-midterm-electionshttps://242750075.fs1.hubspotusercontent-na2.net/hubfs/242750075/Toplines%20-%20Montana%20Senate%20late%20July%2020260723_143910%20(2).pdfhttps://254labs.io/news/2026-07-txsenhttps://abacusdata.ca/the-trade-war-next-door-what-american-voters-think-about-tariffs-canada-and-the-battle-for-the-u-s-senate/https://aldailynews.com/poll-barry-moore-leads-everett-wess-in-u-s-senate-race/https://backend.natpublicaffairs.com/media/Iowa_General_Election_Memo_101526.3.pdfhttps://backend.natpublicaffairs.com/media/NE_Tracker_R2_Trend_Memo_102226.7.pdfhttps://backend.natpublicaffairs.com/media/NH_General_Election_Memo_101526.2.pdfhttps://battlegrounds.coefficient.org/ak/https://battlegrounds.coefficient.org/fl/https://battlegrounds.coefficient.org/ia/https://battlegrounds.coefficient.org/ks/https://battlegrounds.coefficient.org/me/https://battlegrounds.coefficient.org/mi/https://battlegrounds.coefficient.org/mn/https://battlegrounds.coefficient.org/ne/https://battlegrounds.coefficient.org/nh/https://battlegrounds.coefficient.org/oh/https://betterfutureai.org/docs/mike-rogers-support-for-ai-security.pdfhttps://bsky.app/profile/deecherrywriter.bsky.social/post/3mw7hmiyunc2ghttps://carolinaforward.org/news/the-october-2026-carolina-forward-poll/?emci=e7b29264-2cc4-f111-bf5b-000d3a4fbe83&emdi=beb3dd17-f1c6-f111-bf5b-000d3a4fbe83&ceid=27194997https://cdn.sanity.io/files/ifn0l6bs/production/48e9d3be8a69fc295c00da2c82d13ad0b4eeb2e4.pdfhttps://cdn.sanity.io/files/ifn0l6bs/production/6921ab6530dc305f0b905212787c0fa48aa821ca.pdfhttps://cdn.votehub.com/pdfs/VoteHub_Verasight_Oct_2026_Ohio_Report_D1CB7735.pdfhttps://cdn.votehub.com/pdfs/VoteHub_Verasight_Oct_2026_Texas_Report_D8A925D0.pdfhttps://changeresearch.com/research/2026/2026-09-28-florida-aapor-methodology-statementhttps://commonwealthbeacon.org/politics/poll-healey-cruising-in-reelection-bid-with-trump-high-on-voters-mind/https://d3nkl3psvxxpe9.cloudfront.net/documents/ttw_fl_20260921_lv.pdfhttps://d3nkl3psvxxpe9.cloudfront.net/documents/ttw_ga_20260915.pdfhttps://d3nkl3psvxxpe9.cloudfront.net/documents/ttw_ia_20261006_lv.pdfhttps://d3nkl3psvxxpe9.cloudfront.net/documents/ttw_ks_20260921_lv.pdfhttps://d3nkl3psvxxpe9.cloudfront.net/documents/ttw_me_20260902.pdfhttps://d3nkl3psvxxpe9.cloudfront.net/documents/ttw_mi_20260921_lv.pdfhttps://d3nkl3psvxxpe9.cloudfront.net/documents/ttw_ne_20260921_lv.pdfhttps://d3nkl3psvxxpe9.cloudfront.net/documents/ttw_nh_20260921_lv.pdfhttps://d3nkl3psvxxpe9.cloudfront.net/documents/ttw_oh_20260921_lv.pdfhttps://d3nkl3psvxxpe9.cloudfront.net/documents/ttw_tx_20260921_lv.pdfhttps://data.ddhq.io/polls/2026/08/29/EPIC-MRA-Michiganhttps://data.ddhq.io/polls/2026/09/24/Rasmussen-Reports-North-Carolinahttps://data.ddhq.io/polls/2026/09/30/Zenith-Research/Brian-Bengs-South-Dakota-2026-09-24-2026-09-27https://data.ddhq.io/polls/2026/10/23/GBAO/Working-Class-Majority-Nebraska-2026-10-18-2026-10-22https://docs.google.com/document/d/1u6Y5rUbSLEoS0nBgXqKarEzHEQCOzxPjj_Wm27eHKE8/edit?tab=t.0https://drive.google.com/file/d/1awt_8mANYVHZ0UlMxkit8QAVLpDe8k5R/viewhttps://drive.google.com/file/d/1c_Oz7n375ncOkmMWPs8DJTKcBD3Gke4-/viewhttps://drive.google.com/file/d/1e2r7nm_omQkzU9N5XySW6BidnadoY3vB/viewhttps://drive.google.com/file/d/1nVC9doKmSak5hQ8ajaaKftWiXSEZf-Us/viewhttps://eloncdn.blob.core.windows.net/eu3/sites/819/2026/10/Elon-Poll-news-release-10-20-26.pdfhttps://emersoncollegepolling.com/iowa-2026-poll-u-s-senate-race-tightens-sand-maintains-edge-for-governor/https://emersoncollegepolling.com/kansas-2026/https://emersoncollegepolling.com/michigan-2026-poll-el-sayed-and-rogers-locked-in-close-election/https://emersoncollegepolling.com/texas-2026-poll-toss-up/https://en.wikipedia.org/wiki/2026_United_States_Senate_election_in_Alaskahttps://en.wikipedia.org/wiki/2026_United_States_Senate_election_in_Arkansashttps://en.wikipedia.org/wiki/2026_United_States_Senate_election_in_Minnesotahttps://en.wikipedia.org/wiki/2026_United_States_Senate_election_in_Montanahttps://en.wikipedia.org/wiki/2026_United_States_Senate_election_in_Oklahomahttps://en.wikipedia.org/wiki/2026_United_States_Senate_election_in_Texashttps://enjoyer.com/michigan-poll-fall-2026/https://forwardmontana.org/results-of-new-polling-on-the-montana-u-s-senate-election/https://fox56news.com/news/kentucky/new-poll-shows-charles-booker-trailing-just-behind-andy-barr-in-race-for-senate/https://freshstartpac.org/wp-content/uploads/2026/10/SC-Senate-Track-Public-Memo.pdfhttps://insideradvantage.com/fl-u-s-senate-survey-top-line-tabs/https://insideradvantage.com/insideradvantage-georgia-survey-jackson-leads-by-two-in-race-for-governor-ossoff-leads-by-eight-in-senate-contest/https://insideradvantage.com/insideradvantage-senate-surveys-mi-el-sayed-47-rogers-46-ia-hinson-47-turek-45-oh-brown-47-husted-44/https://insideradvantage.com/insideradvantage-senate-surveys-texas-paxton-49-talarico-48-kansas-marshall-48-hamilton-47-maine-jackson-49-collins-47/https://insideradvantage.com/insideradvantage-south-carolina-senate-graham-leads-by-one-point/https://insideradvantage.com/insideradvantage-survey-u-s-senate-minnesota-contest-a-one-point-race-flanagan-46-tafoya-45/https://insideradvantage.com/nc-top-line-tabs/https://insideradvantage.com/nh-top-line-tabs/https://ippsr.msu.edu/news/msu-poll-shows-democrats-lead-republicans-coalesce-behind-rogershttps://itrfoundation.org/wp-content/uploads/2026/09/ITR-Foundation-Poll-Toplines-09-11-2026.pdfhttps://jamesmadison.org/wp-content/uploads/JMI-October-2026-Poll-Marginals.pdfhttps://kstp.com/kstp-news/top-news/kstp-surveyusa-poll-early-frontrunners-in-governor-and-senate-races-ag-a-toss-up/https://kstp.com/kstp-news/top-news/kstp-surveyusa-poll-swing-in-senate-and-ag-races-klobuchar-up-slightly-on-demuth/https://maristpoll.marist.edu/wp-content/uploads/2026/10/Marist-Poll_Iowa_NOS-and-Tables_202610131230@3bcy%5Ew.pdfhttps://maristpoll.marist.edu/wp-content/uploads/2026/10/Marist-Poll_MI-NOS-and-Tables_202610191238FFx09@Jal.pdfhttps://maristpoll.marist.edu/wp-content/uploads/2026/10/Marist-Poll_Maine-NOS-and-Tables_202610051032xtc92617B.pdfhttps://maristpoll.marist.edu/wp-content/uploads/2026/10/Marist-Poll_OH-NOS-and-Tables_202610191215zz9hjdV2l.pdfhttps://maristpoll.marist.edu/wp-content/uploads/2026/10/Marist-Poll_TX-NOS-and-Tables_202610131056%5Eal3j7.pdfhttps://mcusercontent.com/34be366ade846d769ee678a97/files/3ae10722-76ee-42da-fe74-aaa63817df92/IMPACT_NEBRASKA_INTERESTED_PARTIES_POLL_MEMO_OCTOBER_2026.pdfhttps://montanafreepress.org/2026/09/11/alme-holds-an-8-point-lead-over-bodnar-in-senate-race/https://overtoninsights.com/wp-content/uploads/2026/09/Overton_Insights_Texas_Public_Policy_Foundation_Toplines_and_Demographics-3.pdfhttps://pollfinity.com/polls/tx-governor-senate-2026-octhttps://quantusinsights.org/f/michigan-senate-el-sayed-48-rogers-47-at-four-weeks-outhttps://quantusinsights.org/f/new-quantus-polls-moody-leads-in-florida-flanagan-in-minnesotahttps://quantusinsights.org/f/quantus-insights-hinson-holds-narrow-edge-in-iowa-senate-racehttps://quantusinsights.org/f/quantus-insights-survey-sullivan-peltola-deadlocked-in-alaskahttps://quantusinsights.org/polling/f/brown-and-husted-deadlocked-in-ohio-senate-racehttps://quantusinsights.org/polling/f/montana-senate-alme-leads-by-16-as-bodnar-consolidateshttps://quantusinsights.org/polling/f/quantus-survey-collins-and-jackson-even-in-maine-senate-racehttps://quantusinsights.org/polling/f/roy-cooper-leads-michael-whatley-by-five-in-north-carolinahttps://reconmr.com/wp-content/uploads/2026/08/Texas-Pulse-August-Release-August-7-2026-Final.pdfhttps://reconmr.com/wp-content/uploads/2026/10/TXP004-October-Press-Release.pdfhttps://results.surveyusa.com/client/PollReport.aspx?g=0a876c84-9a95-4995-9218-82b1015f5d77https://results.surveyusa.com/client/PollReport.aspx?g=6e6ded19-6ad8-4379-8fa9-6a15dfa99052https://results.surveyusa.com/client/PollReport.aspx?g=d94236a7-5861-4b7f-9d81-d5a81ab786cchttps://s3.documentcloud.org/documents/28623723/tx926allvoterresults.pdfhttps://s3.documentcloud.org/documents/28724874/fl1026results.pdfhttps://salve.edu/documents/pell-center-vov-october-2026-reporthttps://scholars.unh.edu/cgi/viewcontent.cgi?article=2004&context=survey_center_pollshttps://scholars.unh.edu/cgi/viewcontent.cgi?article=2006&context=survey_center_pollshttps://scholars.unh.edu/cgi/viewcontent.cgi?article=2007&context=survey_center_pollshttps://scholars.unh.edu/survey_center_polls/1009/https://scholarworks.bgsu.edu/cgi/viewcontent.cgi?article=1028&context=depohttps://st1.uvnimg.com/65/9b/a8b15584426684070c3d05cf6e34/n-univision-florida-poll-crosstabs-base-final.pdfhttps://static.foxnews.com/foxnews.com/content/uploads/2026/10/fox_october-15-19-2026_ohio_topline_october-21-release.pdfhttps://static.foxnews.com/foxnews.com/content/uploads/2026/10/fox_october-16-20-2026_maine_topline_october-22-release.pdfhttps://static.politico.com/0f/52/d84e43ae45cf803b787113de4d91/daga-ks-interested-parties-memo-10-01-26.pdfhttps://static.politico.com/37/ce/d434188d4d2b83a7e3c9bcf2427c/gbao-hamilton-polling-memo-100626.pdfhttps://static01.nyt.com/newsgraphics/documenttools/517739e11050c66b/43ffa3c2-full.pdfhttps://static01.nyt.com/newsgraphics/documenttools/b31cf2744465b8b7/1a8b655b-full.pdfhttps://static1.squarespace.com/static/5f14ae6fb2a20e01e9c6d608/t/6ac40987eb519d3ce159c107/1791232391610/Mitchell%2BMI%2BPoll%2BUS%2BSENATE%2BPress%2BRelease%2B1043PM%2B10-4-26_A.pdfhttps://static1.squarespace.com/static/663253f0bc87b7070102f41f/t/6a84d771481c4817e92f0eee/1787090801301/AR+Aug+26+Polling+Memo.pdfhttps://static1.squarespace.com/static/67aa7aa3e284b002cd6a420e/t/6ab15cb39e4cc420b9ef07f5/1790008500236/TSUSept2026_TXStatewideRaces.pdfhttps://static1.squarespace.com/static/6994d571bce3436c60d86870/t/6ad8a5ec13c20404a1f8052b/1792583148294/UNF+PORL+FALL+Statewide+2026+FLLV+-+Press+Release+1021+EMBARGO.pdfhttps://surveyresearch-ecu.reportablenews.com/pr/ecu-poll-cooper-s-lead-holds-at-7-pointshttps://talkbusiness.net/2026/10/poll-cotton-takes-lead-over-shoffner/https://tennsight.com/wp-content/uploads/2026/08/Beacon-Poll-of-TN-August-2026-Crosstabs-Party-Ideology-and-Region-1.pdfhttps://texaspublicopinionresearch.substack.com/p/october-poll-in-texas-general-electionhttps://tippinsights.com/league-of-american-workers-survey-michigan-2/https://tippinsights.com/league-of-american-workers-survey-minnesota/https://washingtonreporter.news/exclusive-mike-rogers-leads-in-michigan-john-james-nearly-tied-poll-shows/https://www.aarp.org/content/dam/aarp/research/topics/voter-opinion-research/politics/2026-midterm-election-poll-maine.doi.10.26419-2fres.01065.013.pdfhttps://www.aarp.org/content/dam/aarp/research/topics/voter-opinion-research/politics/2026-midterm-election-poll-michigan.doi.10.26419-2fres.01065.010.pdfhttps://www.aarp.org/press/releases/2026-09-10-new-aarp-texas-poll-highly-motivated-older-voters-could-shape-close-senate-governor-races/https://www.abqjournal.com/news/journal-poll-ben-ray-lujan-keeps-comfortable-lead-in-reelection-bid-for-us-senate-seat/3141065https://www.activote.net/polls/2026/fl-u-s-senate/https://www.activote.net/polls/2026/ga-u-s-senate/https://www.activote.net/polls/2026/il-u-s-senate/https://www.activote.net/polls/2026/nc-u-s-senate/https://www.activote.net/polls/2026/oh-u-s-senate/https://www.activote.net/polls/2026/tx-u-s-senate/2026-10-21/https://www.advancedtargetingresearch.com/_files/ugd/03a624_0fca9a6dd7f846f7bc96f97429561064.pdfhttps://www.ajc.com/politics/2026/10/ajc-poll-ossoff-leads-collins-in-georgias-us-senate-race/https://www.al.com/politics/2026/10/gop-faces-election-downturn-but-theres-no-blue-wave-for-alabama-democrats-poll-shows.htmlhttps://www.anselm.edu/about/anselmian-hub/news/new-saint-anselm-college-poll-finds-democrats-leading-congressional-races-affordability-concerns-shape-election-landscapehttps://www.bigdatapoll.com/blog/buckeye-state-poll-sherrod-brown-leads-jon-husted-for-us-senate-in-ohio/https://www.bigdatapoll.com/blog/lone-star-state-poll-talarico-paxton-in-close-race-us-senate-in-texas/https://www.bigdatapoll.com/blog/north-star-state-poll-peggy-flanagan-holds-slight-lead-over-michele-tafoya-for-us-senate-in-minnesota/https://www.bigdatapoll.com/blog/peach-state-poll-jon-ossoff-opens-up-lead-over-mike-collins-in-georgia/https://www.bigdatapoll.com/blog/tar-heel-state-poll-roy-cooper-holds-solid-lead-over-michael-whatley-for-us-senate-in-north-carolina/https://www.bigdatapoll.com/blog/wolverine-state-poll-el-sayed-leads-rogers-for-us-senate-in-michigan/https://www.carolinajournal.com/wp-content/uploads/2026/10/H25035-CJ-NC-Oct26-Toplines.pdfhttps://www.catawba.edu/news/all-news/2026/yougov-39/https://www.cbsnews.com/news/maine-senate-poll-2026-10-02/https://www.cbsnews.com/news/texas-senate-talarico-paxton-poll/https://www.cnwmedia.com/article/cnw-poll-pritzker-leads-bailey-by-20-points-democrats-ahead-in-four-other-statewide-raceshttps://www.commoncause.org/north-carolina/wp-content/uploads/2026/09/CCNC-Sep-2026-Poll-Release-1.pdfhttps://www.cookpolitical.com/analysis/survey-research/battleground-district-project/senate-battleground-district-project-octoberhttps://www.detroitnews.com/story/news/politics/2026/09/08/michigan-senate-poll-mike-rogers-abdul-el-sayed/91653231007/https://www.documentcloud.org/documents/28549388-oh-sen-gov-ag-tulchin-research-for-john-kulewicz/https://www.documentcloud.org/documents/28585312-sd-sen-impact-research-for-brian-bengs/https://www.documentcloud.org/documents/28608783-cnn-poll-conducted-by-ssrs-maine/https://www.documentcloud.org/documents/28608784-cnn-poll-conducted-by-ssrs-michigan/https://www.documentcloud.org/documents/28686304-aarp-2026-north-carolina-statewide-survey-topline-1/https://www.documentcloud.org/documents/28729016-cnn-ohio-poll-conducted-by-ssrs/https://www.documentcloud.org/documents/28729018-cnn-iowa-poll-conducted-by-ssrs/https://www.documentcloud.org/documents/28817212-sd-sen-gov-concord-public-opinion-partners-oct-2026/https://www.filesforprogress.org/datasets/2026/8/dfp_ms_ge26_aug2026_crosstabs.pdfhttps://www.foxnews.com/politics/fox-news-poll-democratic-enthusiasm-shapes-north-carolina-senate-racehttps://www.foxnews.com/politics/fox-news-poll-michigan-voters-split-between-el-sayed-rogershttps://www.foxnews.com/politics/fox-news-poll-texas-senate-race-galloping-toward-photo-finishhttps://www.foxnews.com/politics/fox-news-poll-turek-hinson-close-iowa-senate-racehttps://www.gelliottmorris.com/p/2026-07-28-exclusive-independent-leads-democrat-against-republican-montanahttps://www.highpoint.edu/src/files/2023/08/HPU-Poll-126-Memo-08192026.pdfhttps://www.highpoint.edu/src/files/2023/08/HPUPoll127MemoA-1.pdfhttps://www.kare11.com/article/news/politics/elections/minnesota-poll-flanagan-with-narrow-lead-over-tafoya-in-us-senate-race/89-ed06354a-4656-4cc0-907e-12e67119cf00https://www.keloland.com/keloland-com-original/keloland-poll-rounds-leads-bengs-at-8-trump-approval-down/https://www.linkedin.com/posts/derrick-bell-sr-ba9266314_lake-research-partners-poll-826-activity-7511202704690470912-9N39https://www.mdwcomm.com/media/florida-statewide-poll-october-2026.htmlhttps://www.montanarightnow.com/elections/montana-senate-race-kurt-alme-tops-bodnar-and-bankhead-in-new-poll-findings/article_cd8401fb-0470-492c-a53a-c7dfe39552ff.htmlhttps://www.nrsc.org/wp-content/uploads/2026/09/9-1-26-NRSC-NH-Polling-Memo.pdfhttps://www.nytimes.com/2026/09/24/us/politics/democrats-show-strength-in-michigan-senate-race-but-trail-in-maine-polls-find.htmlhttps://www.nytimes.com/interactive/2026/10/03/polls/times-siena-alaska-poll-toplines.htmlhttps://www.nytimes.com/interactive/2026/10/03/polls/times-siena-iowa-poll-toplines.htmlhttps://www.nytimes.com/interactive/2026/10/03/polls/times-siena-kansas-poll-toplines.htmlhttps://www.nytimes.com/interactive/2026/10/03/polls/times-siena-ohio-poll-crosstabs.htmlhttps://www.nytimes.com/interactive/2026/10/03/polls/times-siena-texas-poll-toplines.htmlhttps://www.politico.com/f/?id=000001a0-e76b-d462-adb2-e7fba4200000https://www.politico.com/f/?id=000001a1-6905-d95c-abe7-ffe73ad80000https://www.politico.com/newsletters/playbook/2026/08/12/newsoms-swing-and-miss-state-tour-01035105https://www.politico.com/newsletters/playbook/2026/09/28/trumps-joes-exit-the-front-row-01094720https://www.rasmussenreports.com/public_content/archive/election_2026/minnesota_senate_democrat_flanagan_still_holds_slender_leadhttps://www.rasmussenreports.com/public_content/politics/elections/election_2026/election_2026_alaska_senatehttps://www.rasmussenreports.com/public_content/politics/elections/election_2026/election_2026_georgia_senatehttps://www.rasmussenreports.com/public_content/politics/elections/election_2026/election_2026_iowa_senate2https://www.rasmussenreports.com/public_content/politics/elections/election_2026/election_2026_maine_senatehttps://www.rasmussenreports.com/public_content/politics/elections/election_2026/election_2026_michigan_senatehttps://www.rasmussenreports.com/public_content/politics/elections/election_2026/election_2026_ohio_senatehttps://www.rasmussenreports.com/public_content/politics/elections/election_2026/election_2026_south_carolina_senatehttps://www.rasmussenreports.com/public_content/politics/elections/election_2026/election_2026_texas_senatehttps://www.rasmussenreports.com/public_content/politics/elections/election_2026/n_h_senate_democrat_pappas_leads_by_double_digitshttps://www.realclearpolitics.com/docs/2026/Toplines-Michigan-Statewide-August2026.pdfhttps://www.sdnewswatch.org/south-dakota-poll-us-senate-rounds-bengs/https://www.stetson.edu/artsci/cpor/media/cpor-fall-2026-report-wave-2-october.pdfhttps://www.stpetepolls.org/files/StPetePolls_2026_State_Gov_October7_K7ZU3GA.pdfhttps://www.suffolk.edu/-/media/suffolk/documents/academics/research-at-suffolk/suprc/polls/massachusetts2/2026/10_20_2026_massachusetts_statewide_marginals.pdf?la=en&hash=12AC3ACF484DC216ED83A879BAF0781ACEA5FC89https://www.suffolk.edu/-/media/suffolk/documents/academics/research-at-suffolk/suprc/polls/other-states/2026/10_14_2026_maine_press_release.pdfhttps://www.suffolk.edu/-/media/suffolk/documents/academics/research-at-suffolk/suprc/polls/other-states/2026/10_7_2026_iowa_statewide_marginals.pdf?la=en&hash=2D72AC4AC373F8C2FA39466A7E5CD59D2370B6F9https://www.suffolk.edu/-/media/suffolk/documents/academics/research-at-suffolk/suprc/polls/other-states/2026/9_22_2026_michigan_statewide_marginals.pdf?la=en&hash=6738E3056D284CD6D4733F5FB9C38684431D4884https://www.suffolk.edu/-/media/suffolk/documents/academics/research-at-suffolk/suprc/polls/other-states/2026/9_29_2026_ohio_embargoed_marginals_part_1.pdfhttps://www.thebullfinchgroup.com/post/for-immediate-release-independent-todd-achilles-within-4-points-among-likely-votershttps://www.thedailyagenda.com/p/morning-take-the-daily-agenda-poll/https://www.thetrafalgargroup.org/news/ks-senate-general-1001/https://www.thetrafalgargroup.org/news/me-senate-gen-1002/https://www.thetrafalgargroup.org/news/mi-senate-general-1001/https://www.thetrafalgargroup.org/wp-content/uploads/2026/09/AK-Midterms-Survey-Report-0925.pdfhttps://www.thetrafalgargroup.org/wp-content/uploads/2026/09/NH-Midterms-Survey-Report-0927.pdfhttps://www.thetrafalgargroup.org/wp-content/uploads/2026/09/OH-Midterms-Full-Report-0917.pdfhttps://www.thetrafalgargroup.org/wp-content/uploads/2026/10/GA-General-Report-1010.pdfhttps://www.thetrafalgargroup.org/wp-content/uploads/2026/10/IA-Midterms-Report-1017.pdfhttps://www.thetrafalgargroup.org/wp-content/uploads/2026/10/MN-Midterms-Report-1017.pdfhttps://www.thetrafalgargroup.org/wp-content/uploads/2026/10/NC-Gen-Sen-Poll-Report-1011.pdfhttps://www.thetrafalgargroup.org/wp-content/uploads/2026/10/SC-Midterms-Survey-Report-1019.pdfhttps://www.thetrafalgargroup.org/wp-content/uploads/2026/10/TX-Midterms-Report-1009.pdfhttps://www.uh.edu/hobby/texas2026/index.phphttps://www.umass.edu/poll/about/reports/2026-10-massachusetts-public-opinion-pollhttps://www.uml.edu/docs/2026-Sept-Maine-Topline_tcm18-422748.pdfhttps://www.uml.edu/news/press-releases/2026/10092026-texas-poll.aspxhttps://www.univision.com/noticias/politica/poll-univision-texas-2026https://www.washingtonpost.com/documents/08fa9b5e-43ac-456c-a706-4c33ec6506dc.pdf?itid=lk_inline_manual_2https://www.washingtonpost.com/documents/916dd450-a193-4312-9a75-1b14dd95cc28.pdf?itid=lk_inline_manual_1https://www.wpri.com/12-news-emerson-college-poll-results-october-2026/https://x.com/JacobRubashkin/status/2106137210185462099https://x.com/NenoNicolosio/status/2098189872330678723https://x.com/andrewjfhoward/status/2112507944633811183https://x.com/burgessev/status/2102451722702442813https://x.com/rbrtraining/status/2108302504446337272https://yellowhammernews.com/report-doug-jones-is-polling-worse-than-2020-blowout-election/
A forecast, not a certainty
Figures are recalculated every day with the published polls. Latest calculation: October 24, 2026.
A race given at 70% is lost by the favourite three times in ten. Joint control of the House and the Senate is on the overview page.
Run SENATE-COMMON-STATE-POLL-REFRESH-20261024 · 200,000 draws